
DOT Price Prediction: Relief Rally to $1.32 Before 30% Crash Risk
Rebeca Moen
Apr 21, 2026 04:59
Polkadot’s weak bounce from oversold levels sets up a bull trap at $1.32 resistance before the next leg down threatens sub-$1.00 territory within 30 days.
The Immediate Setup
DOT sits precariously at $1.28, caught in a narrow consolidation that reeks of indecision. The recent bounce from $1.25 lows lacks conviction, with buyers stepping in only to preserve psychological support rather than drive meaningful recovery. This tepid response to oversold conditions suggests the underlying trend remains firmly bearish.
The token trades in a tight $1.25-$1.29 range as market participants wait for the next catalyst. Neither bulls nor bears want to commit significant capital at these levels, creating a coiling pattern that typically resolves with violent moves. Given the broader technical damage, any breakout is more likely to favor the downside.
Trading activity remains subdued as institutional flows have clearly shifted away from DOT. The lack of meaningful volume during recent bounces indicates this is purely retail-driven price action rather than smart money accumulation.
Key Levels Exposed
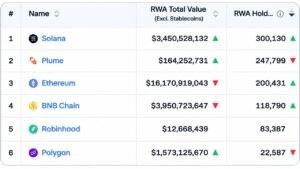
The moving average structure tells a brutal story of systematic breakdown. DOT trades well below all major moving averages, with the 200-day average sitting as distant overhead resistance. Even short-term averages have turned bearish, creating multiple layers of resistance on any meaningful recovery attempt.

The $1.32 level emerges as the key battleground where recent rallies have failed. This zone coincides with previous support turned resistance and represents the last line of defense for bears. A push toward this level would likely attract renewed selling pressure from trapped longs looking to exit.
Downside support at $1.25 has been tested multiple times and shows signs of weakening. Break this floor and the path opens toward psychological support at $1.00, with few meaningful levels in between to halt a descent.
Sentiment vs Reality
Retail positioning reveals a dangerous disconnect between hope and technical reality. Long-heavy positioning in derivatives markets creates fuel for potential liquidation cascades if the next leg down begins in earnest. This crowded long trade increases the probability of sharp moves lower as overleveraged positions get flushed.
The absence of fresh institutional interest or positive fundamental catalysts leaves DOT vulnerable to technical selling. Without new money entering the ecosystem, current price levels remain dependent on existing holders maintaining conviction – a fragile foundation given the extended bearish price action.
Market structure suggests complacency has set in at these levels, with many traders treating the current consolidation as a bottoming process rather than a pause before further decline.
Hourly candlesticks (about 96 bars), same endpoint as our cryptocurrency price pages. Numbers below refresh from 1-minute klines.
Full DOT price, calculator & analysis
Actionable Trade Strategy
Bear Case (70% Probability): Target short positions on any push toward $1.30-$1.32 resistance with tight stops above $1.35. The risk-reward favors bears with initial targets at $1.15 and extension toward $1.00 if momentum accelerates. The combination of weak technicals and poor sentiment creates multiple tailwinds for this scenario.
Bull Case (30% Probability): Only consider long exposure above decisive breaks of $1.35 on substantial volume. Such a move would invalidate near-term bearish structure and open path toward $1.50. However, any rallies should be treated as selling opportunities given the longer-term technical damage.
The highest probability outcome sees DOT complete one more leg lower toward sub-$1.00 levels as the final capitulation phase plays out. Patient traders should wait for clear technical signals rather than trying to catch falling knives at current levels.
Image source: Shutterstock