

US Bitcoin ETFs Hit 11-Day Inflow Streak with $588M Led by BlackRock Despite Macro Fears – Can $107K Push to $112K ATH?

Crypto Journalist
Anas Hassan

Crypto Journalist
Anas Hassan

Share


Bitcoin exchange-traded funds (ETFs) have defied mounting geopolitical tensions and Federal Reserve uncertainty by recording their eleventh consecutive day of positive inflows, attracting $588.55 million in fresh capital as of June 24, according to SosoValue data.
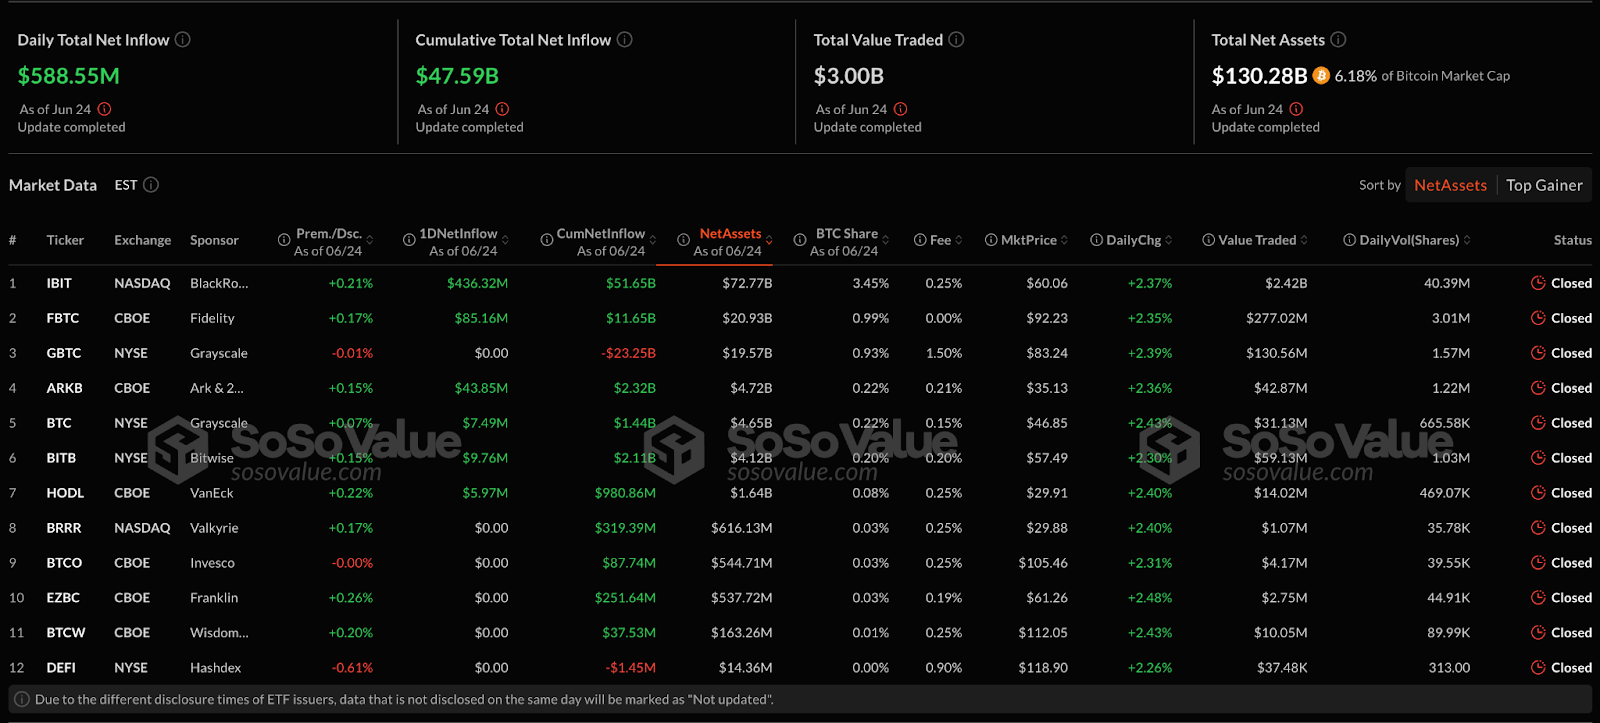
BlackRock’s IBIT dominated the session with $436.32 million in inflows, showing institutional confidence in Bitcoin despite the cryptocurrency trading around $107,000 after recent volatility. It briefly touched $111,917 earlier this year before retreating amid escalating Middle East tensions.
The sustained ETF momentum comes as Bitcoin maintains its crucial psychological support above $100,000, a level it has defended since early May.
Institutional players like Strategy continue aggressive accumulation strategies. On June 16, Strategy purchased 10,100 additional coins for $1.05 billion, bringing its total holdings now close to 600,000 Bitcoin.
The eleven-day streak represents the ninth consecutive week of positive flows for digital asset investment products, contributing to a year-to-date total of $13.2 billion despite broader market concerns over the Israel-Iran conflict.
Bitcoin ETFs: Institutional Capital Defies Geopolitical Storm
While Bitcoin initially sold off alongside global equities when Israel launched late-night airstrikes against Iran, with Tehran responding in kind, the digital asset’s recovery above $100,000, coupled with sustained ETF demand, suggests institutions are increasingly treating Bitcoin as a portfolio diversifier rather than a risk-on speculation.
YouHodler’s head of risk, Sergei Gorev, recently noted that while gold initially captured safe-haven flows, Bitcoin’s recovery indicates markets don’t “firmly believe in the active development of the Iran-Israel conflict phase,” with declining dollar strength benefiting both precious metals and cryptocurrencies.
Institutional resilience becomes even more pronounced considering President Trump’s aggressive campaign against Federal Reserve Chair Jerome Powell. He branded him a “numbskull” and demanded immediate rate cuts that could save the United States $300 billion annually.
However, the continuous ETF inflows suggest institutions are positioning for potential monetary easing while simultaneously hedging against currency debasement. Recent Producer Price Index data strengthen arguments for rate cuts later this year.
Corporate adoption continues to accelerate despite macro uncertainties. Anthony Pompliano’s ProCap BTC acquired 3,724 Bitcoin for $386 million as part of plans to go public through an SPAC merger, while Japan’s Metaplanet raised $517.8 million on the first day of its ambitious “555 Million Plan,” which targets 210,000 Bitcoin by 2027.
These developments, combined with Norway’s Green Minerals’ plan to purchase $1.2 billion in Bitcoin and Trump Media’s $2.3 billion treasury strategy, demonstrate that institutional conviction transcends short-term volatility.
Technical Breakout Signals Point to $112K Target
Bitcoin’s current technical structure reveals a compelling setup that aligns perfectly with the sustained ETF inflow momentum, with multiple timeframes suggesting an imminent breakout toward new cycle highs.
The 3-hour chart displays Bitcoin trapped within a descending wedge pattern, with critical resistance at “The Edge” formation around $109,000, coinciding with recent highs near $111,917. At the same time, support around $99,000 has been successfully defended multiple times.
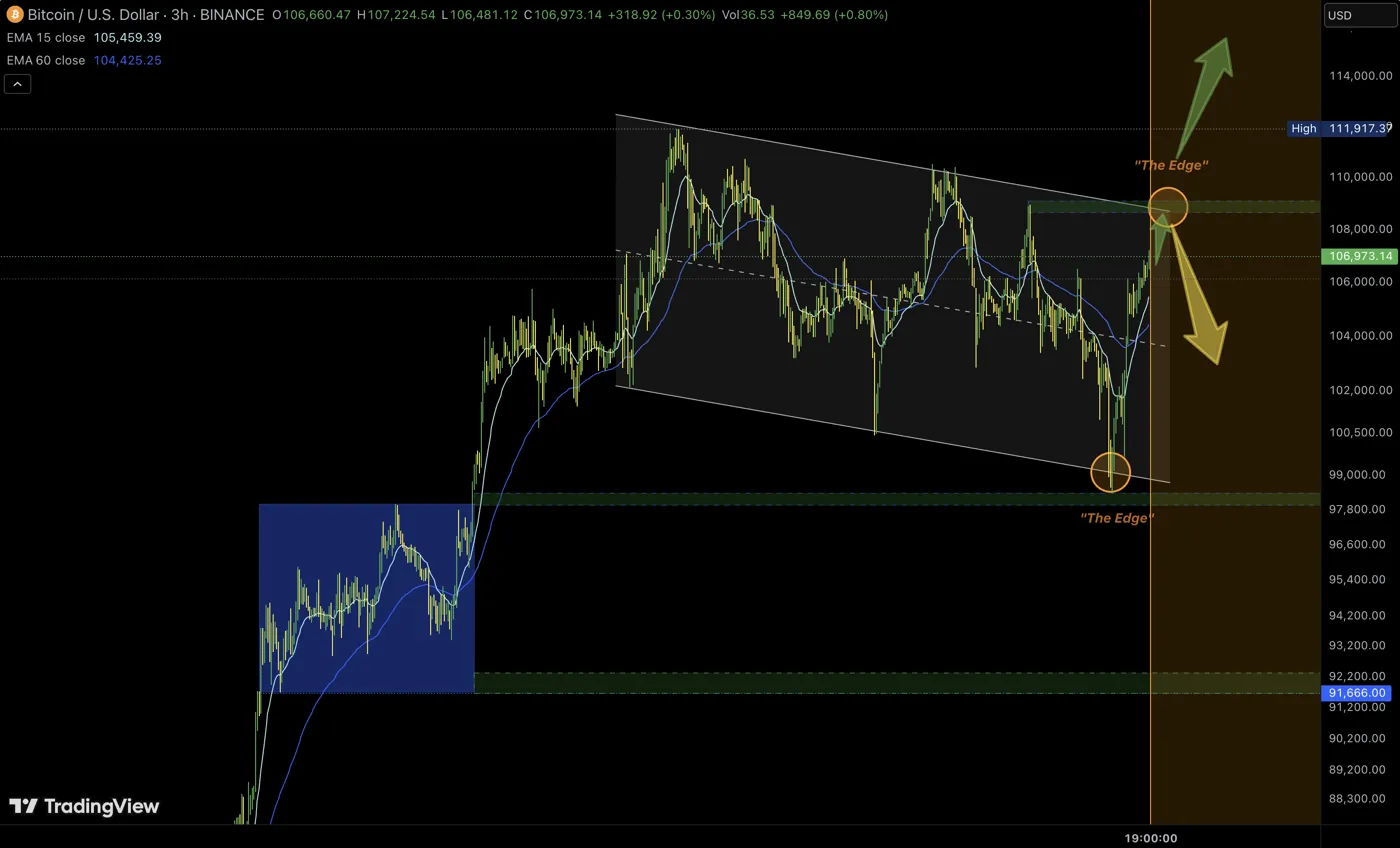
The exponential moving averages show the 15-period EMA at $105,459 positioned above the 60-period EMA at $104,425, indicating short-term momentum building upward despite broader consolidation.
Notably, the monthly chart, as shown by analyst MerlijnTheTrader, provides extraordinary insight into Bitcoin’s cyclical behavior. It reveals a consistent pattern of three-year bull runs followed by one-year corrections that has repeated with remarkable precision.
Currently in its three-year expansion phase, which began in 2022 and is projected through 2025, Bitcoin appears positioned for significant upside potential. Momentum indicators are approaching but not yet reaching the extreme overbought levels that historically marked cycle tops.
This cyclical analysis suggests any near-term weakness represents consolidation within the broader advance, with ultimate targets potentially reaching $150,000 – 200,000 based on historical precedent.
The comparative analysis of Bitcoin’s 2020 and 2025 cycles reveals striking similarities in price action and momentum characteristics. Both cycles exhibited comparable consolidation patterns before experiencing major advances.
The MACD indicators show both cycles experiencing deep negative divergences during consolidation phases before generating powerful bullish momentum. The 2025 cycle appeared at a similar inflection point that preceded the 2020 parabolic advance to $42,000.
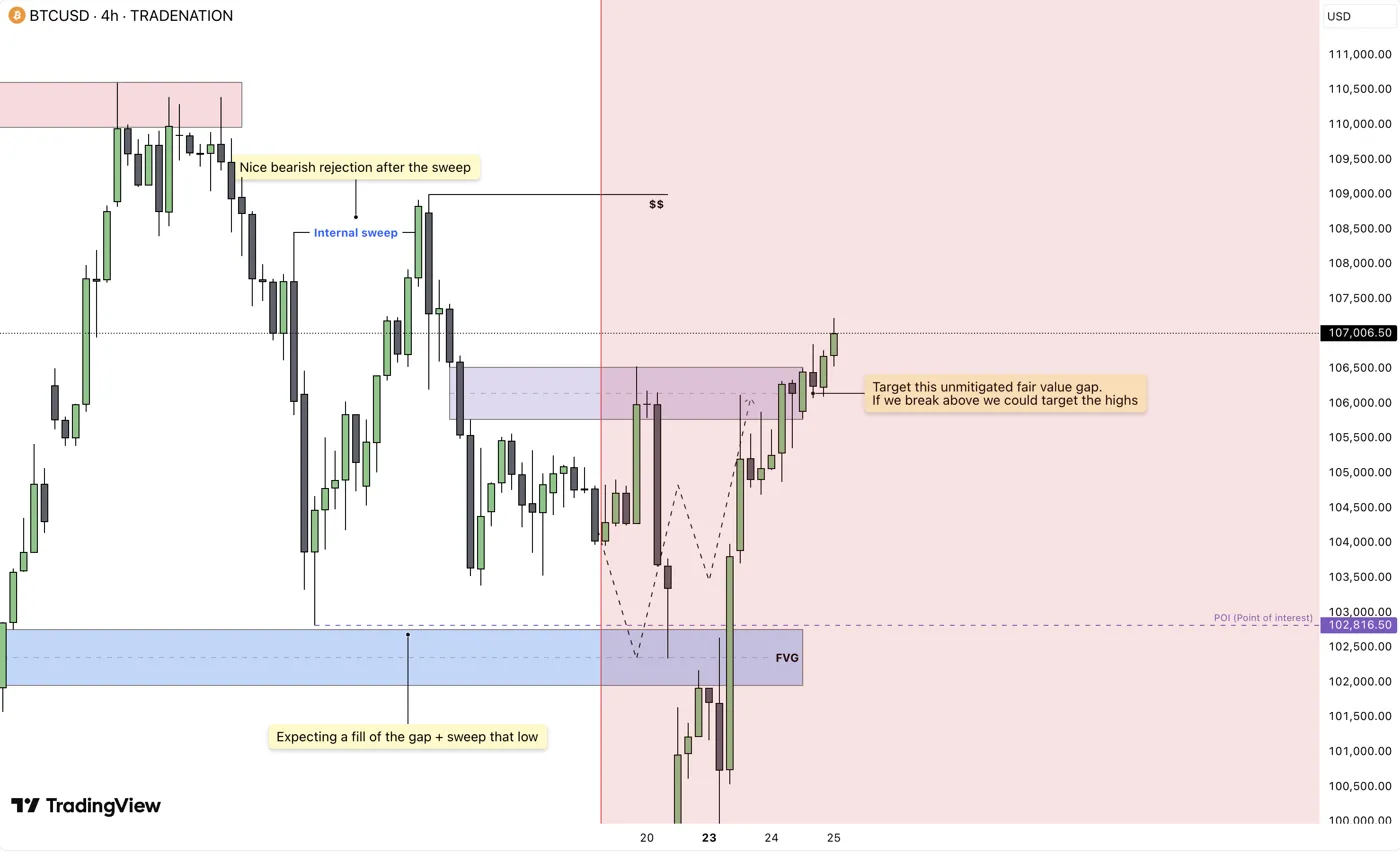
The 4-hour chart identifies successful gap fills and Fair Value Gap testing around $102,500-103,000, with an “unmitigated fair value gap” in the upper resistance zone.
A break above $107,000-108,000 could trigger algorithmic buying toward previous highs near $111,917, perfectly positioning Bitcoin to capitalize on the institutional inflow, regulatory clarity from Japan’s proposed crypto tax reforms, and continued corporate treasury adoption.
Trending News
RecommendedPopular Crypto TopicsPrice Predictions