Meta AI Open Sources GCM for Better GPU Cluster Monitoring to Ensure High Performance AI Training and Hardware Reliability
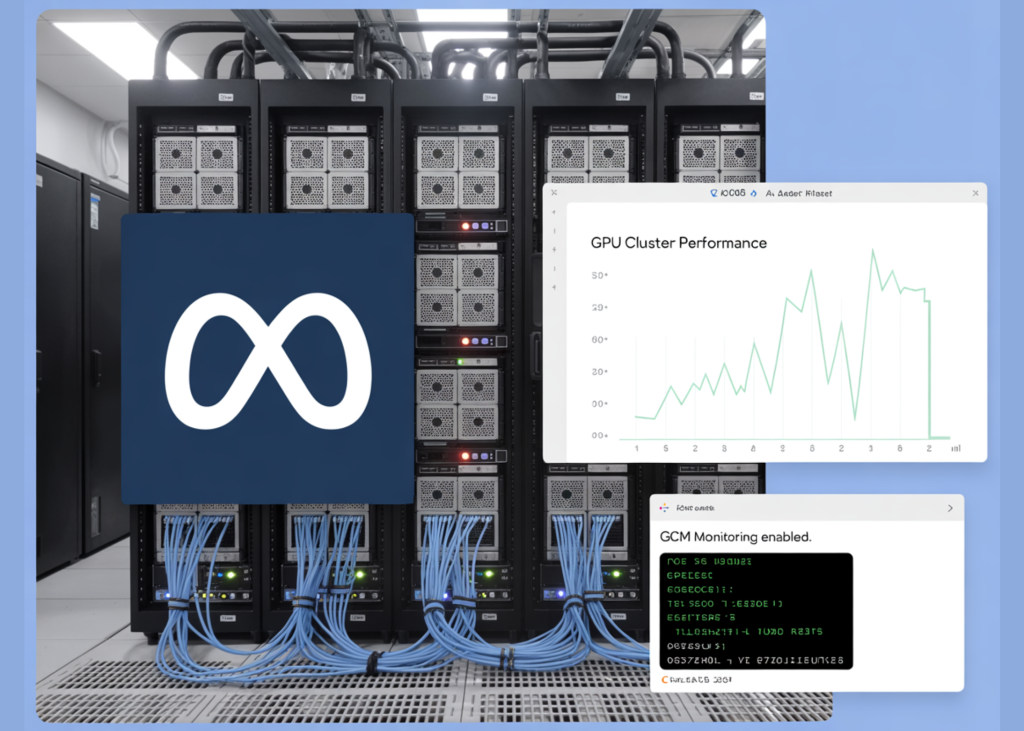
While the tech folks obsesses over the latest Llama checkpoints, a much grittier battle is being fought in the basements of data centers. As AI models scale to trillions of parameters, the clusters required to train them have become some of the most complex—and fragile—machines on the planet.
Meta AI Research team just released GCM (GPU Cluster Monitoring), a specialized toolkit designed to solve the ‘silent killer’ of AI progress: hardware instability at scale. GCM is a blueprint for how to manage the hardware-to-software handshake in High-Performance Computing (HPC).
The Problem: When ‘Standard’ Observability Isn’t Enough
In traditional web development, if a microservice lags, you check your dashboard and scale horizontally. In AI training, the rules are different. A single GPU in a 4,096-card cluster can experience a ‘silent failure’—where it technically stays ‘up’ but its performance degrades—effectively poisoning the gradients for the entire training run.
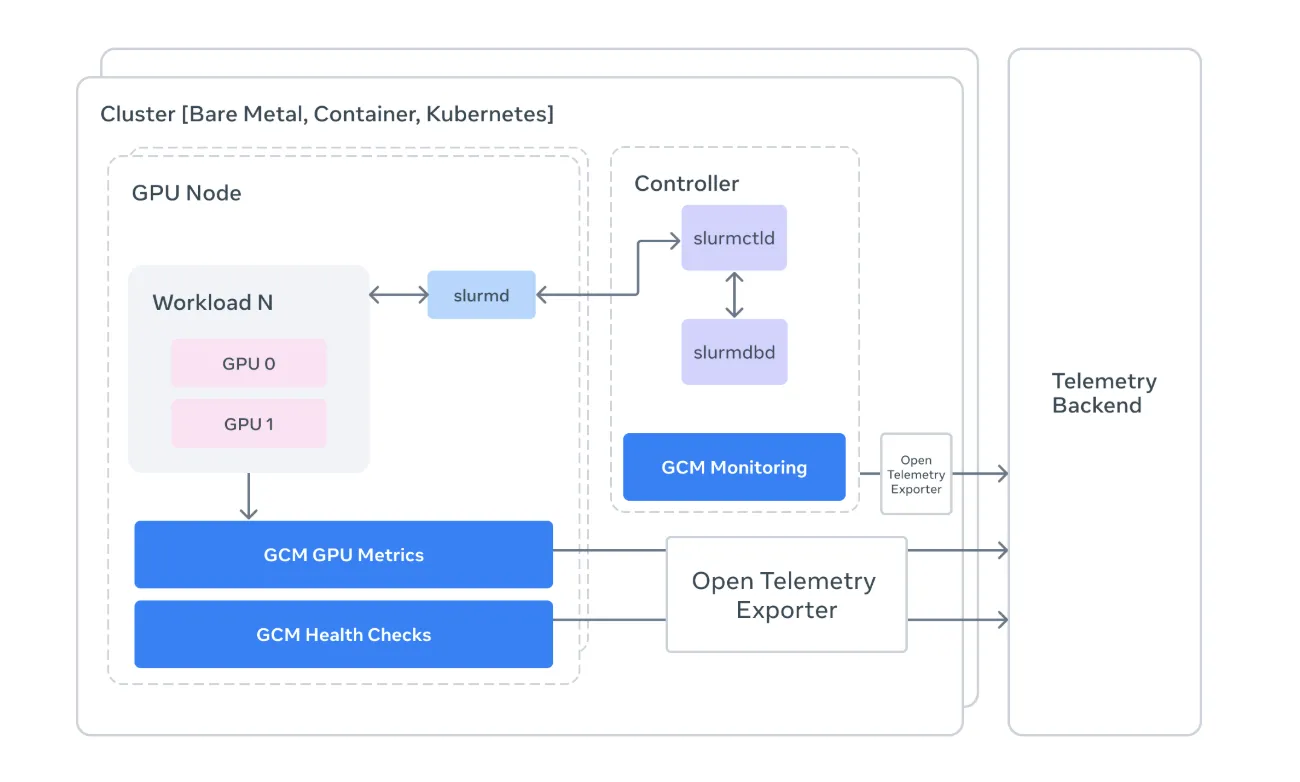
Standard monitoring tools are often too high-level to catch these nuances. Meta’s GCM acts as a specialized bridge, connecting the raw hardware telemetry of NVIDIA GPUs with the orchestration logic of the cluster.
1. Monitoring the ‘Slurm’ Way
For devs, Slurm is the ubiquitous (if occasionally frustrating) workload manager. GCM integrates directly with Slurm to provide context-aware monitoring.
Job-Level Attribution: Instead of seeing a generic spike in power consumption, GCM allows you to attribute metrics to specific Job IDs.
State Tracking: It pulls data from sacct, sinfo, and squeue to create a real-time map of cluster health. If a node is marked as DRAIN, GCM helps you understand why before it ruins a researcher’s weekend.
2. The ‘Prolog’ and ‘Epilog’ Strategy
One of the most technically vital parts of the GCM framework is its suite of Health Checks. In an HPC environment, timing is everything. GCM utilizes two critical windows:
Prolog: These are scripts run before a job starts. GCM checks if the InfiniBand network is healthy and if the GPUs are actually reachable. If a node fails a pre-check, the job is diverted, saving hours of ‘dead’ compute time.
Epilog: These run after a job completes. GCM uses this window to run deep diagnostics using NVIDIA’s DCGM (Data Center GPU Manager) to ensure the hardware wasn’t damaged during the heavy lifting.
3. Telemetry and the OTLP Bridge
For devs and AI researchers who need to justify their compute budgets, GCM’s Telemetry Processor is the star of the show. It converts raw cluster data into OpenTelemetry (OTLP) formats.
By standardizing telemetry, GCM allows teams to pipe hardware-specific data (like GPU temperature, NVLink errors, and XID events) into modern observability stacks. This means you can finally correlate a dip in training throughput with a specific hardware throttled event, moving from ‘the model is slow’ to ‘GPU 3 on Node 50 is overheating.’
Under the Hood: The Tech Stack
Meta’s implementation is a masterclass in pragmatic engineering. The repository is primarily Python (94%), making it highly extensible for AI devs, with performance-critical logic handled in Go.
Collectors: Modular components that gather telemetry from sources like nvidia-smi and the Slurm API.
Sinks: The ‘output’ layer. GCM supports multiple sinks, including stdout for local debugging and OTLP for production-grade monitoring.
DCGM & NVML: GCM leverages the NVIDIA Management Library (NVML) to talk directly to the hardware, bypassing high-level abstractions that might hide errors.
Originally published by marktechpost.com →