

Divergence Signals Indicate a Recovery for Bitcoin and Altcoins

The crypto market shows positive signs in the second half of April 2025. Several divergence signals have appeared, suggesting a potential recovery for Bitcoin and altcoins.
Divergence is a key concept in data analysis. It happens when the values of two metrics suddenly shift and move in opposite directions compared to their previous trend. This often signals a change in price momentum. Based on expert analysis and market data, this article highlights five major divergence signals—three for Bitcoin and two for altcoins—to help investors better understand the market outlook.
3 Divergence Signals in April Point to a Bitcoin Price Rally
Historically, Bitcoin and the DXY Index (US Dollar Index) move in opposite directions. When DXY rises, Bitcoin tends to fall, and vice versa. But from September 2024 to March 2025, Bitcoin and the DXY moved in the same direction.
This correlation broke in April when the US announced a new tariff policy. The inverse relationship seems to have returned.

Joe Consorti, Head of Growth at TheyaBitcoin, noted that Bitcoin started decoupling from the US dollar after the announcement of the sweeping tariff regime. A chart from his post shows that in April, while the DXY fell sharply from 103.5 to 98.5, Bitcoin surged from around $75,000 to over $91,000.
This divergence may reflect investors turning to Bitcoin as a safe-haven asset amid global economic uncertainty caused by the tariffs.
“Bitcoin has been diverging from the US dollar since the US announced its sweeping tariff regime. Amidst this global economic reordering, gold and bitcoin are shining,” Joe Consorti predicted.
Another key divergence comes from Tuur Demeester, an advisor to Blockstream. He pointed out a separation between Bitcoin and the NASDAQ Index, which represents tech stocks. Historically, Bitcoin closely followed the NASDAQ due to its ties to tech and macroeconomic sentiment.
But in April 2025, Bitcoin started showing independent growth. It no longer moves in sync with the NASDAQ. While some, like Ecoinometrics, argue that this divergence isn’t necessarily bullish, Demeester remains optimistic.

“Bitcoin divergence” and “Bitcoin decoupling” will be dominant headlines for 2025,” Tuur Demeester said.
Specifically, NASDAQ has faced downward pressure from interest rate concerns and slowing growth. Meanwhile, Bitcoin has shown strength, with significant price gains. This suggests that Bitcoin is cementing its role as a standalone asset less tied to traditional markets.
Data from CryptoQuant highlights another divergence—this time in investor behavior. Long-term Bitcoin holders (LTH, those who’ve held BTC for over 155 days) began accumulating again after the recent local peak.
In contrast, short-term holders (STH) are selling off. This divergence often signals the early stage of a re-accumulation phase and hints at a future price rebound.
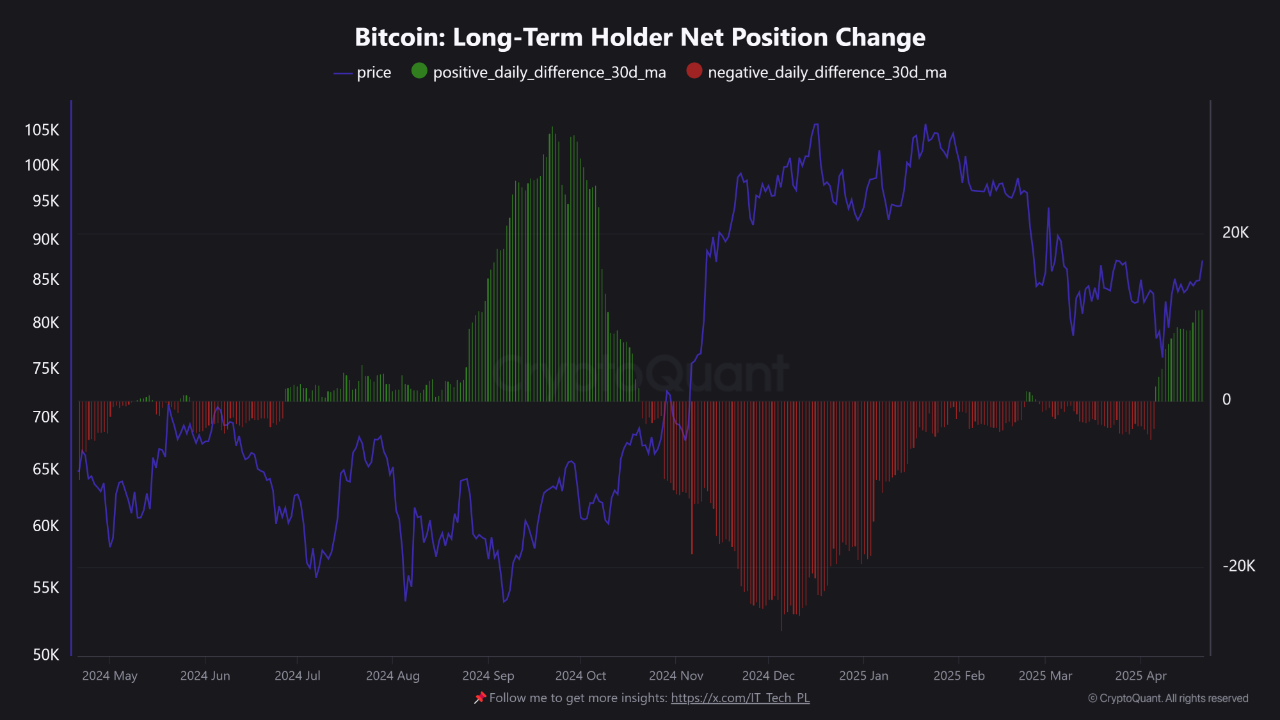
“Why This Divergence Matters? LTH behavior is generally associated with macro conviction, not speculative moves. STH activity is often emotional and reactive, driven by price volatility and fear. When LTH accumulation meets STH capitulation, it tends to signal early stages of a re-accumulation phase,” IT Tech, an analyst at CryptoQuant, predicted.
Altcoin Recovery Round the Corner
Divergence signals also appeared for altcoins, indicating a positive short-term outlook.
Jamie Coutts, Chief Crypto Analyst at Realvision, pointed to a key divergence using the “365-day new lows” indicator. This metric tracks how many altcoins hit their lowest point in the past year.
In April 2025, although altcoin market capitalization dropped to a new low, the number of altcoins hitting new 365-day lows decreased significantly. Historically, this pattern often precedes a recovery in altcoin market caps.
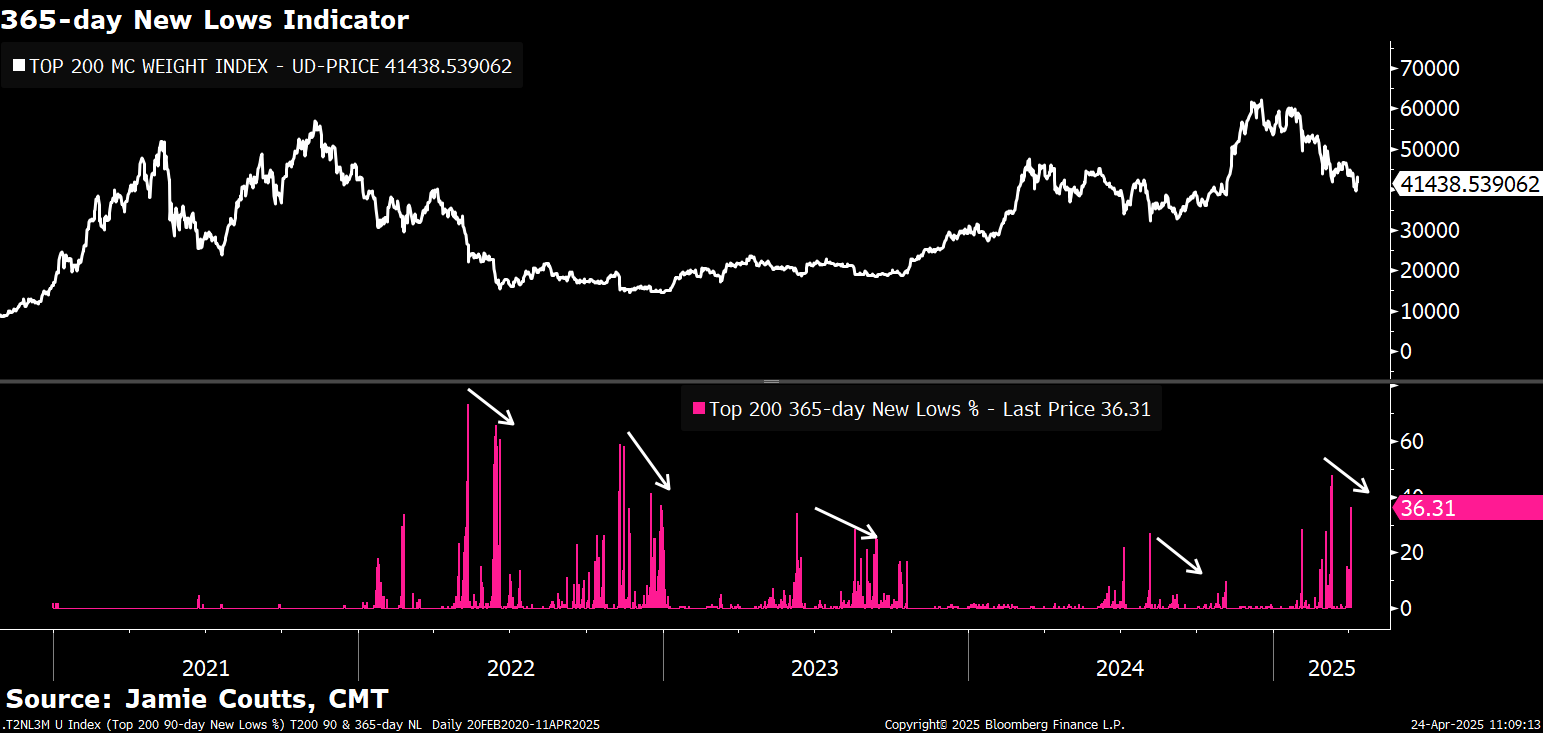
“Divergence shows downside momentum was exhausted,” Jamie Coutts said.
In simpler terms, fewer altcoins hitting rock bottom means less panic-selling. It suggests that negative market sentiment is weakening. At the same time, rising prices show renewed buying interest. These factors hint that altcoins may be gearing up for a recovery—or even an “altcoin season,” a period when altcoins outperform Bitcoin.
Another technical divergence comes from the RSI (Relative Strength Index) on the Bitcoin Dominance chart (BTC.D), noted by analyst Merlijn The Trader. This chart reflects Bitcoin’s share of the total crypto market capitalization.
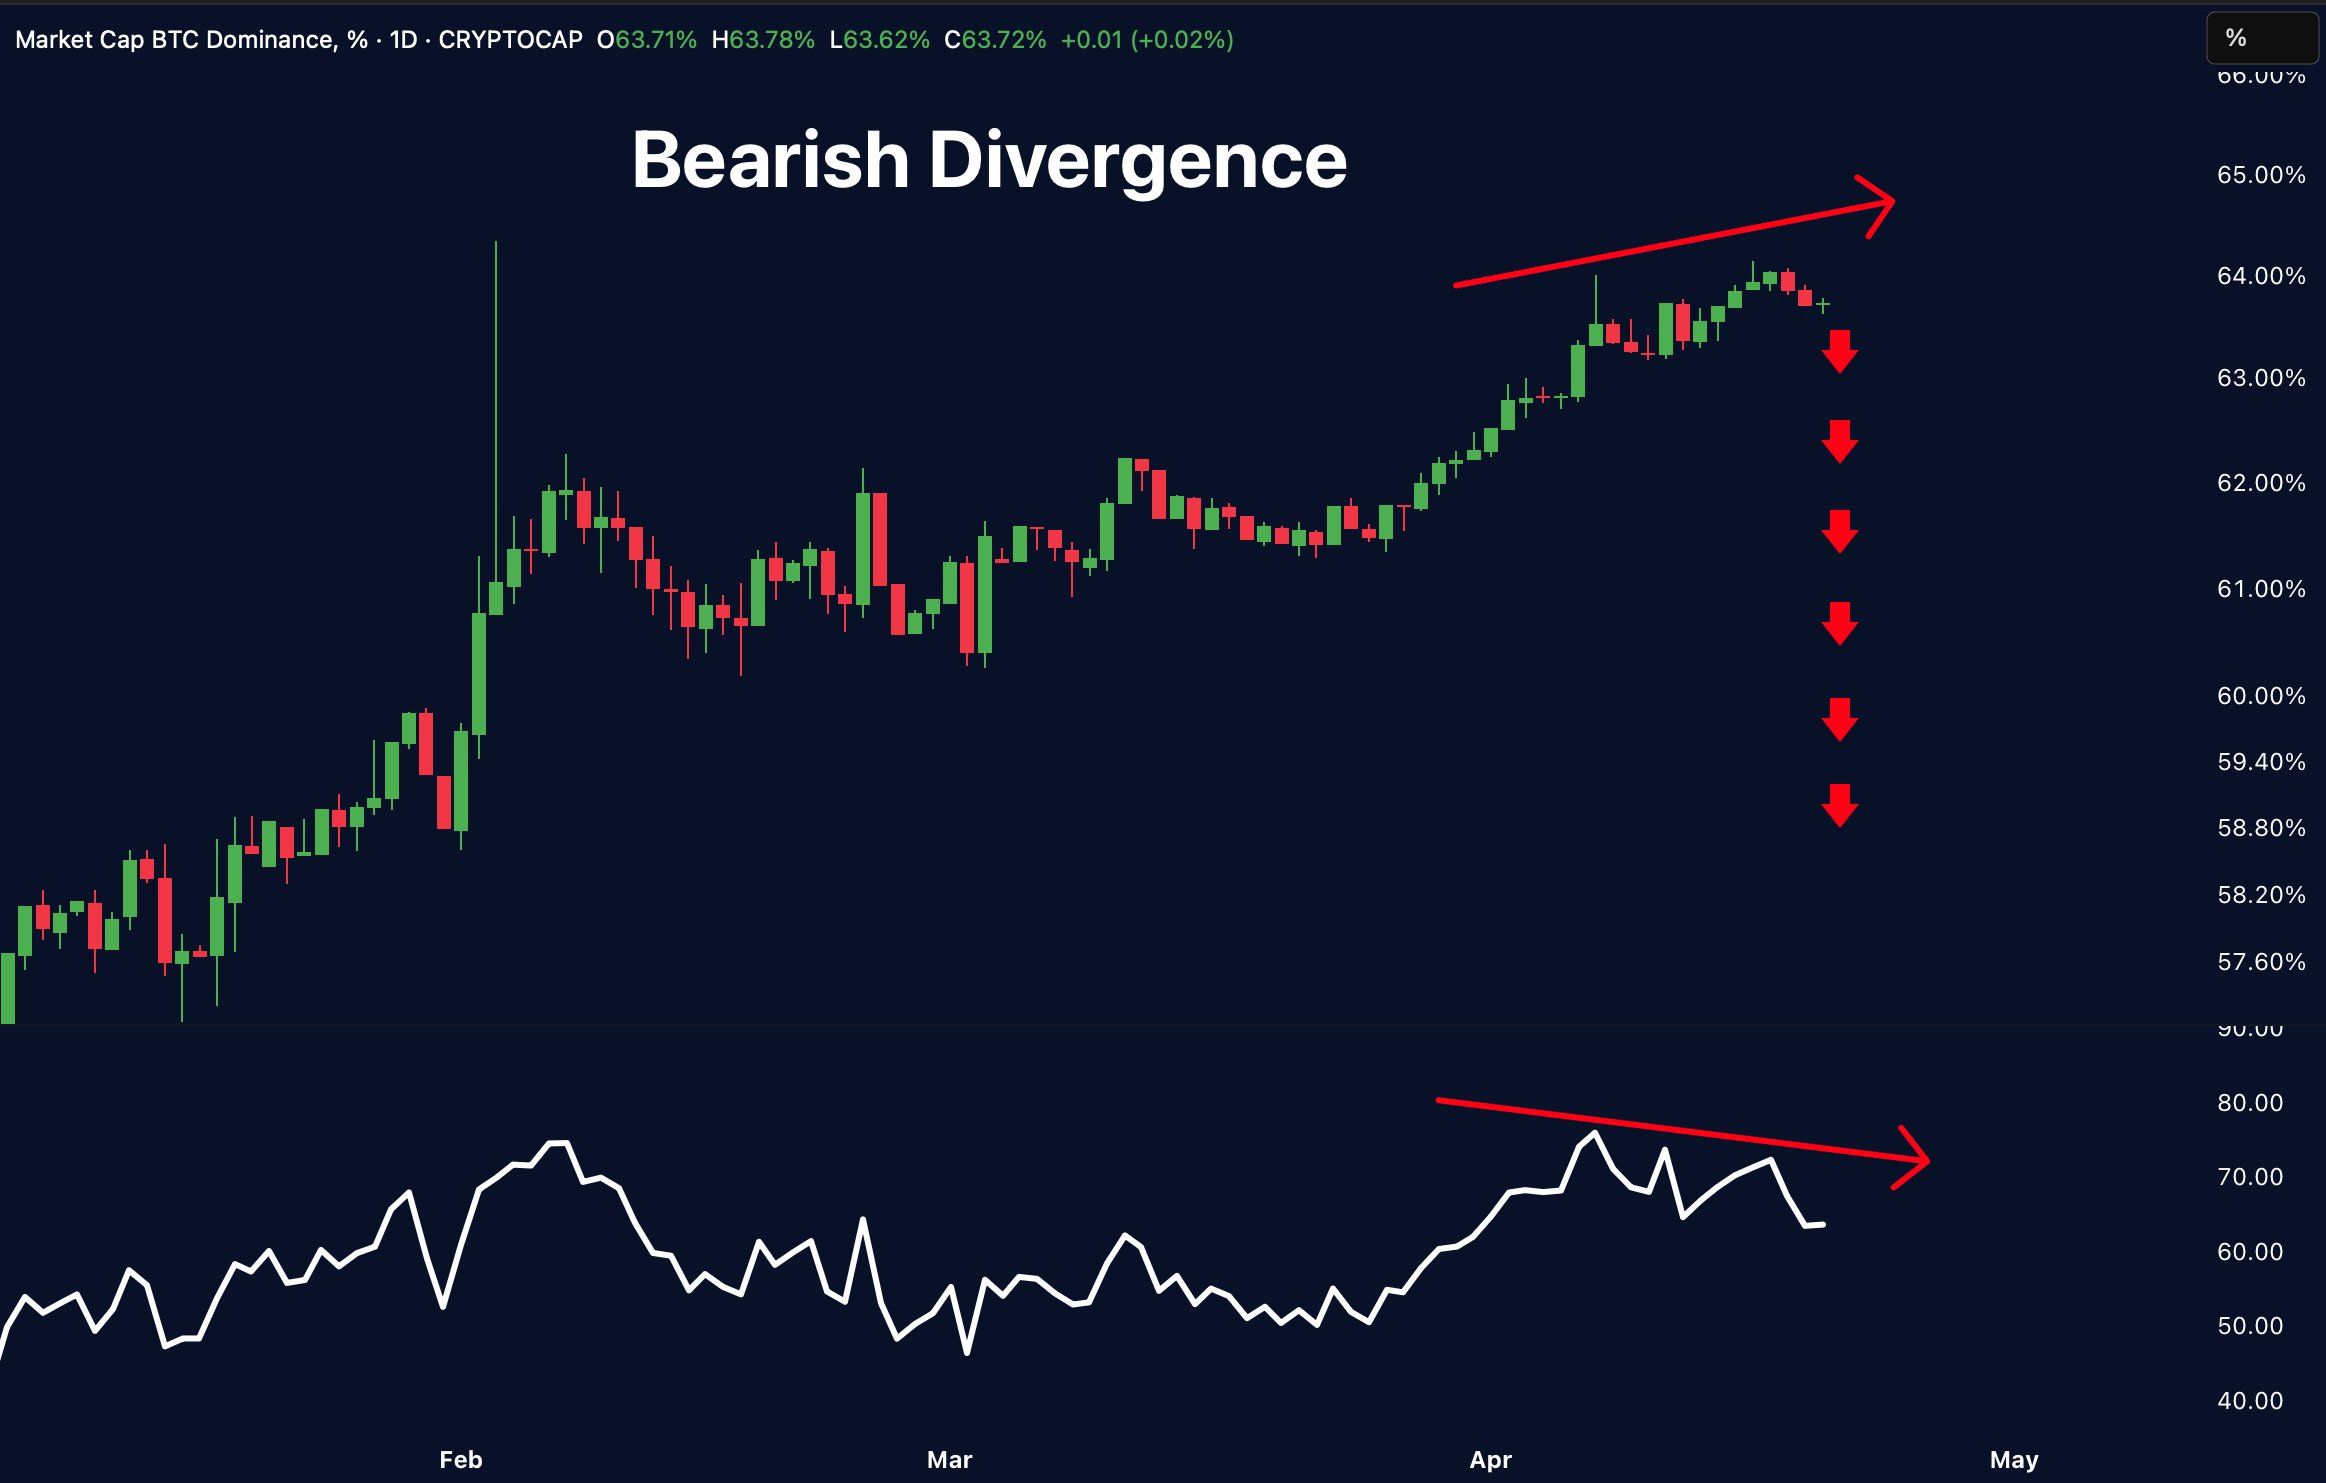
“Bearish Divergence Spotted on BTC.D. Higher highs on the chart. Lower highs on RSI. This setup doesn’t lie. Altcoin strength is brewing. Watch for trade setups,” Merlijn said.
This pure technical divergence suggests that BTC.D might soon undergo a strong correction. If that happens, investors may shift more capital into altcoins.
The altcoin market cap (TOTAL3) rebounded by 20% in April, from $660 billion to over $800 billion. The divergence signals discussed above suggest that this recovery could continue.
Disclaimer
In adherence to the Trust Project guidelines, BeInCrypto is committed to unbiased, transparent reporting. This news article aims to provide accurate, timely information. However, readers are advised to verify facts independently and consult with a professional before making any decisions based on this content. Please note that our Terms and Conditions, Privacy Policy, and Disclaimers have been updated.