Bitcoin Price Pounds the $87K Wall as Bulls Refuse to Back Down
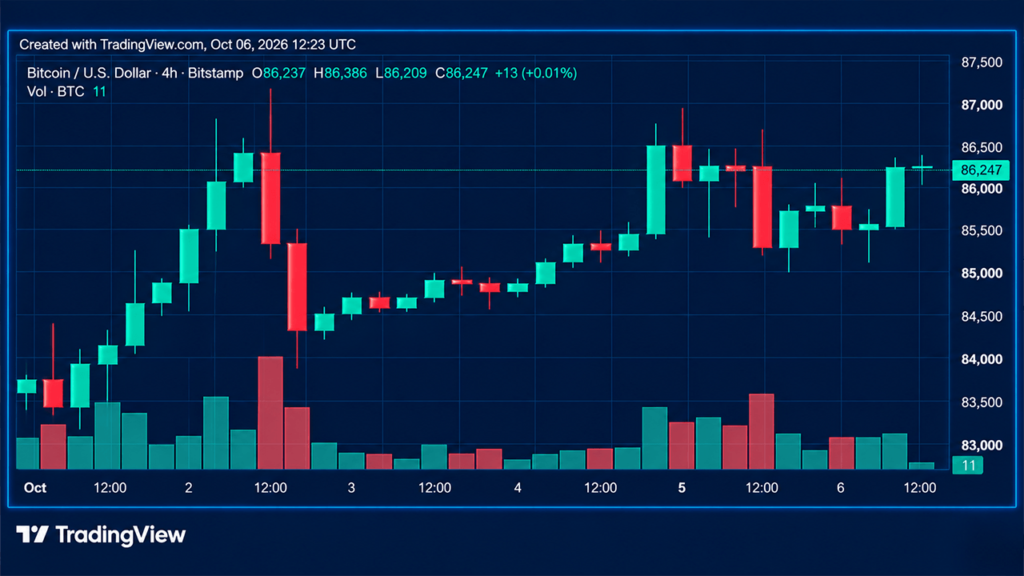
Bitcoin’s price has climbed back within striking distance of $87,374, but the market is arriving at the door with less technical certainty than the price alone suggests. At roughly $86,256 on Tuesday morning, Oct. 6 at 8:20 a.m., the daily and 4-hour structures remain pointed higher, and the moving-average board overwhelmingly favors the bulls, yet the 1-hour chart is showing friction just beneath resistance, leaving $87,000 to $87,374 as the line separating another rejection from a genuine breakout.
1H View: Bitcoin Runs Back Into the $87,000 Wall
The 1-hour chart shows bitcoin rebuilding after its Oct. 2 low near $83,500, including a recovery from the more recent retreat toward $84,900 after buyers were turned away around $87,000 on Oct. 5.
Bitcoin’s price has since climbed back toward $86,300, preserving the short-term recovery, although a large red candle accompanied by a volume spike at the chart’s far right introduces some caution. Support around $85,900 to $86,000 is the first line to watch, followed by $85,000. A close above $87,374 would clear the range ceiling, while another rejection puts $85,000 back on the ticker.
4H View: Bulls Hold Firmer Ground
The 4-hour chart keeps the bullish case on firmer ground. Bitcoin’s Sept. 18 low near $75,600 preceded a run to $87,374, and the market has subsequently traded largely between approximately $82,500 and $87,400.
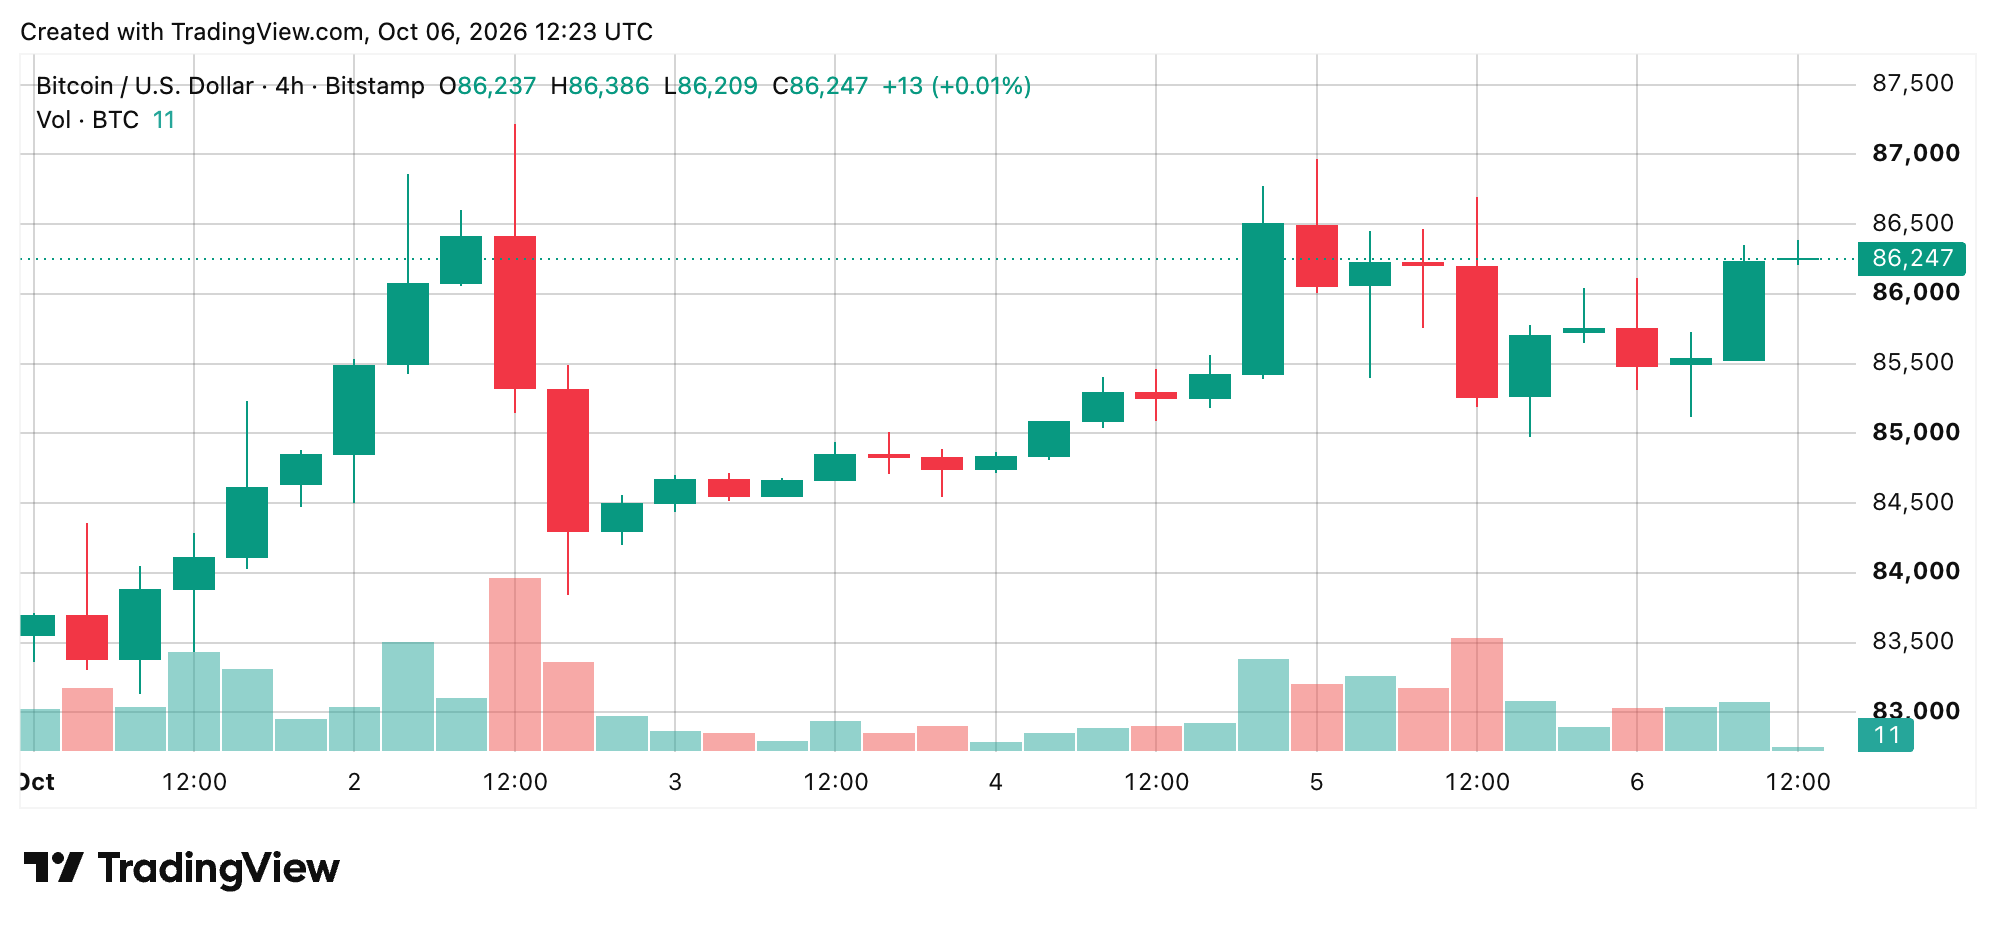
Crucially, the Sept. 29-30 retreat stopped around $82,500, establishing a higher low before buyers marched bitcoin’s price back toward the upper boundary. Volume, however, has remained steady rather than expanding into the latest test. A break through $87,374 would open the door toward the $89,650 Fibonacci resistance level, while losing $85,000 would shift attention toward $83,500 and $82,500.
Daily View: Structure Keeps Bulls in the Driver’s Seat
The daily chart still tells the cleanest bullish story. Bitcoin bottomed around $57,700 in early July, built a base around $63,000 to $65,000 during August, and subsequently broke above $70,000 before establishing a broader $75,000 to $87,000 trading band.
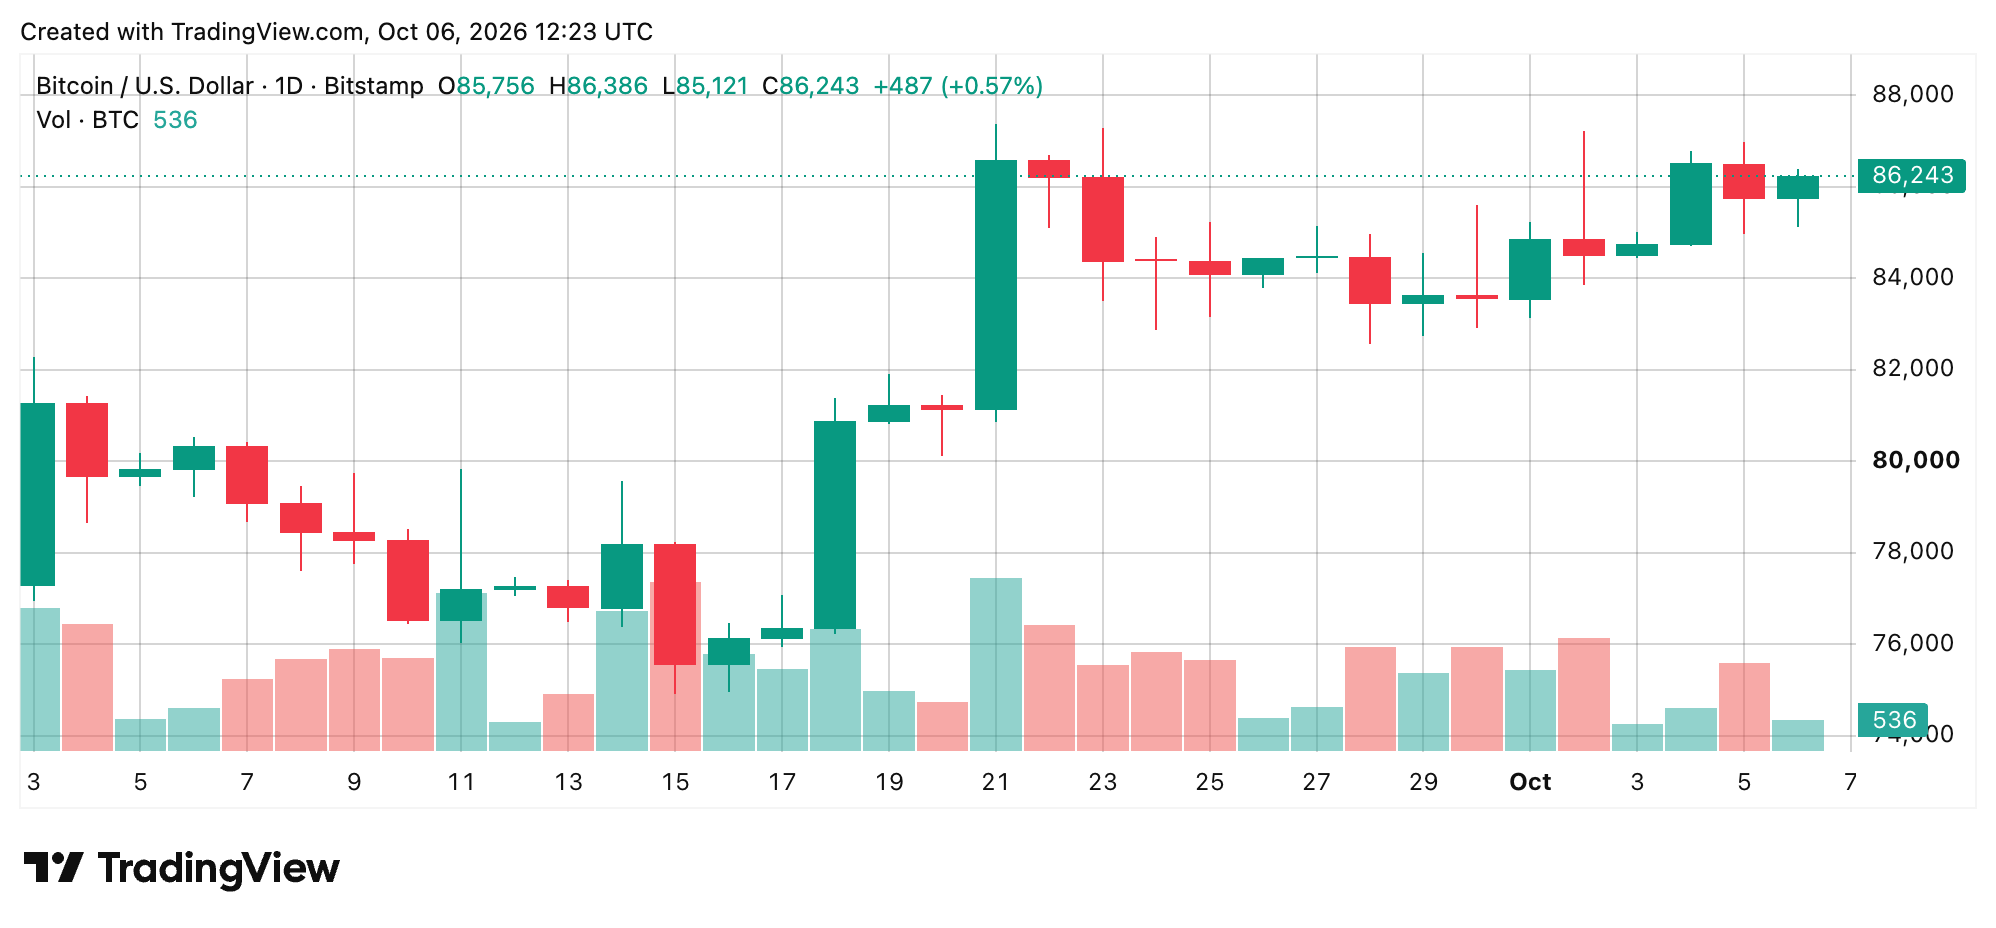
Higher highs and higher lows remain intact, and price is now crowding the band’s upper boundary. That makes $87,374 more than another intraday marker. A daily close above it would establish a fresh range high, while a close below $82,500 would break the higher-low structure that has supported the advance.
Oscillators Aren’t Quite Joining the Party
The daily chart’s oscillators are considerably less enthusiastic than the price structure. The relative strength index (RSI) sits at 66, while the Stochastic, commodity channel index (CCI), average directional index (ADX), Awesome oscillator (AO), stochastic RSI fast, Williams, bull bear power, and Ultimate oscillator (UO) are neutral. ADX at 44 nevertheless points to a strong prevailing trend.
Momentum is bullish at 1,835, while moving average convergence divergence (MACD) is bearish on Tuesday at 1,994. Taken together, the readings suggest bitcoin’s price has trend strength behind it without broad oscillator confirmation for a clean breakout.
Moving Averages Put Bulls Firmly Ahead
Moving averages (MAs) provide the strongest ammunition for buyers, with 13 of 15 readings bullish. The 10-period exponential moving average (EMA) stands at $84,969, and the 10-period simple moving average (SMA) at $84,775.
The 20-period EMA sits at $83,576 against the 20-period SMA at $83,872, while the 50-period EMA and SMA stand at $79,423 and $79,921, respectively. Farther down, the 100-period EMA rests at $75,541 and the SMA at $71,793, while the 200-period EMA sits at $75,059 against the SMA at $71,661. The volume-weighted moving average (VWMA) is bullish at $83,925, although the Hull moving average (HMA) is bearish at $86,465.
Bull verdict:
A close above $87,374 would confirm a fresh range high and put $89,650 in view. The moving-average structure strongly favors buyers, with 13 of 15 readings bullish and price holding comfortably above the major longer-term averages. If momentum strengthens through resistance, the bulls would have a cleaner technical path toward the upper Fibonacci levels.
Bear verdict:
Another rejection between $87,000 and $87,374 would keep bitcoin trapped beneath the range ceiling and put $85,000 back under pressure. A deeper retreat through $83,500 would weaken the short-term structure and expose the important $82,500 higher low. A close beneath $82,500 would break that structure and hand bears considerably more control.


Originally published by news.bitcoin.com →