Oil slumps on Iran deal hopes, Coldcard hack fallout continues

Bitcoin (BTC) starts the first full week of August circling $63,000 as traders weigh the impact of the ongoing Coldcard wallet hack.
Key points:
US Treasury Secretary Scott Bessent leverages a Federal Reserve repo facility for a joint intervention as the Japanese briefly recovers from forty-year lows against the dollarOil prices fall sharply as president Donald Trump gives hope of a deal with Iran.Bitcoin rounds out July 7.4% higher, but warnings of a red August stay in place.
Bessent eyes further yen interventions

Concerns over US Treasury markets were behind the US decision to intervene in the Japanese yen last week. Washington engaged in a rare operation to support the yen after USD/ JPY had reached almost 164 last week, per data from TradingView.
USD/JPY one-day chart. Source: Cointelegraph/TradingView
“It was the first coordinated US–Japan foreign-exchange intervention since 2011 and the first joint operation specifically supporting the yen since 1998,” crypto trading company QCP Capital noted in analysis released on Monday.
“The distinction matters. The New York Fed acted as the Treasury’s fiscal agent rather than as an independent monetary-policy decision by the Federal Reserve. The operation therefore highlights how institutions outside the FOMC can also influence currencies, liquidity and broader financial conditions.”
Speaking to mainstream media, industry insiders placed emphasis on the desire to avoid Japan selling large amounts of US Treasuries. The use of the Fed’s Foreign and International Monetary Authorities (FIMA) repo facility, which allows a handful of foreign central banks to access dollar liquidity without selling Treasuries, supports the theory.
“There is a self-preservation element here. Volatile markets driven by potentially fiscally-aggressive policies from Japan could extend to the U.S. Treasury markets, destabilizing the dollar,” Louise Loo, head of Asia economics at Oxford Economics, told CNBC.
In a post on X, Treasury Secretary Scott Bessent argued that FIMA could make further appearances going forward.
“Friday’s coordinated foreign exchange actions countered disorderly yen movements. Treasury remains attentive and in close communication with our counterparts at MOF and BOJ. We will not hesitate to participate in further joint intervention. The FIMA Repo Facility is an important backstop. We would encourage it to be upsized in the coming months,” he wrote.
Oil dives as Trump teases hope of Iran deal
US nonfarm payrolls data is the main point of interest for crypto and risk asset traders this week. Due on Thursday, the numbers will shed light on the strength of the labor market as recent US inflation prints have delivered mixed signals.
Last month, nonfarm payrolls came in far lower than expected. Only 57,000 jobs were added in June, short of the 114,000 anticipated, while the previous two months’ numbers were revised down by a combined 74,000 jobs. Bitcoin jumped on the news, because weaker labor-market conditions put pressure on the Federal Reserve to soften its stance on rate hikes.
Some market participants expect a rebound in July’s payrolls data. However, macro research firm Continuum Economics simultaneously projects an uptick in unemployment.
“We expect July’s non-farm payroll to rise by 120k overall and by 110k in the private sector, a significant improvement from June’s respective gains of 57k and 49k but largely explained by a recovery in leisure and hospitality. We expect unemployment to rise to 4.3% from 4.2%, reversing a June decline, and an in line with trend 0.3% rise in average hourly earnings,” it forecast last week.
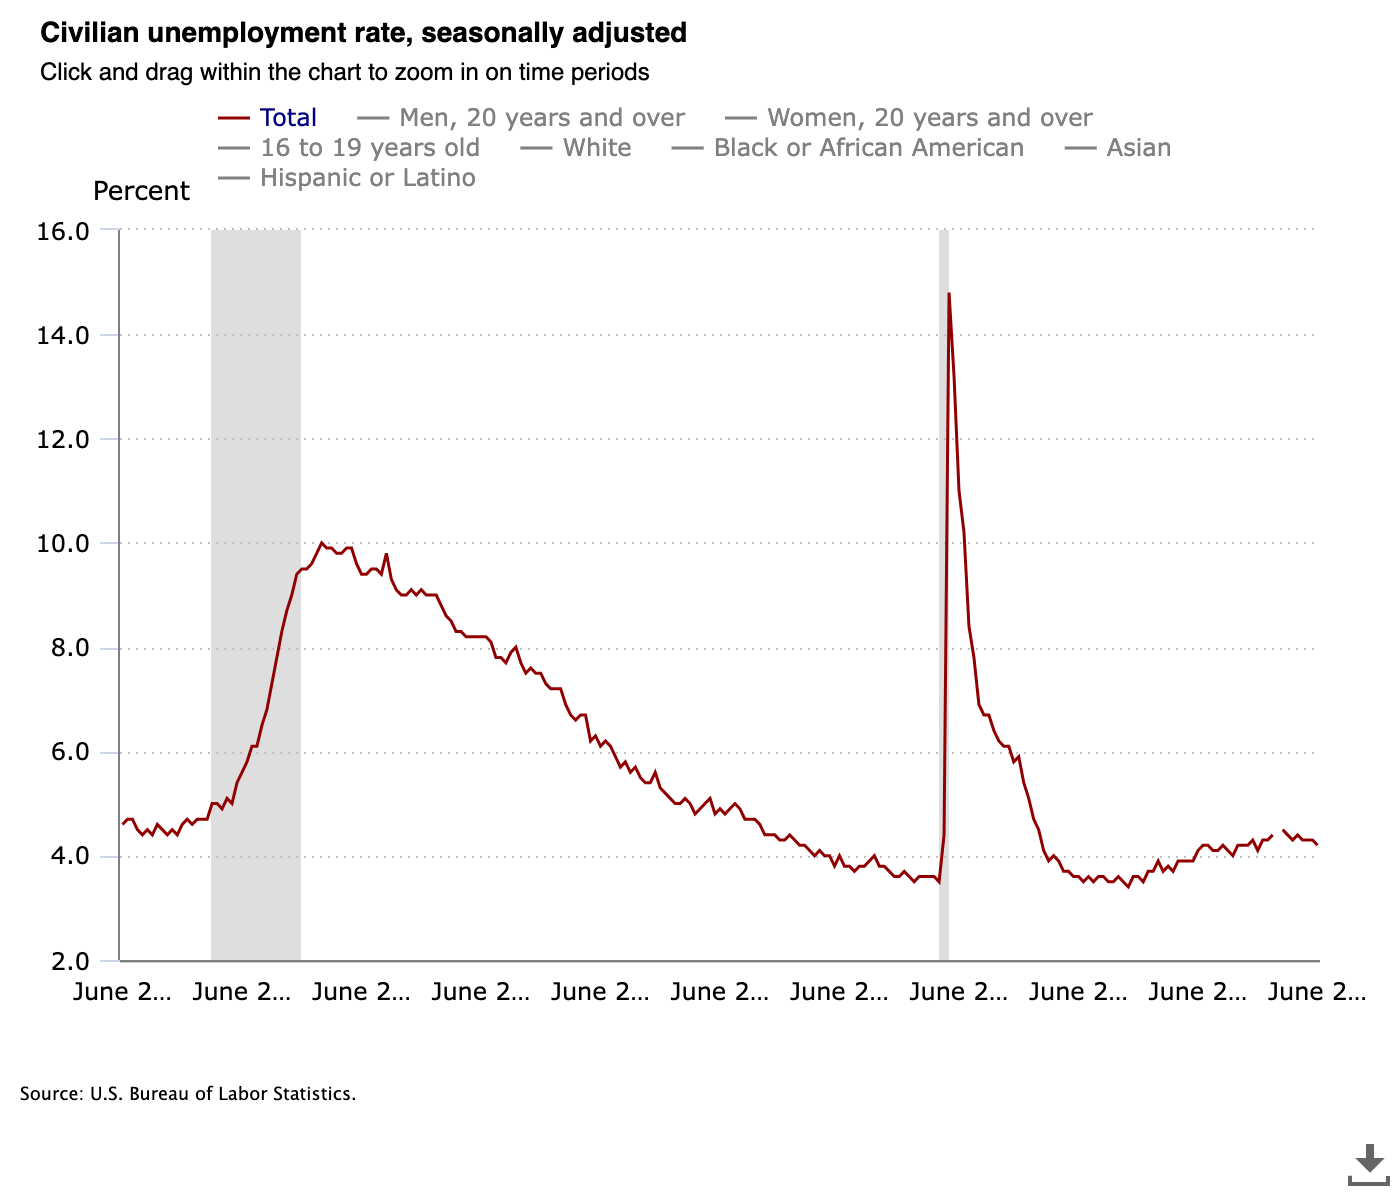
US civilian unemployment rate. Source: Bureau of Labor Statistics
Macroeconomic data prints form just one locus of potential risk-asset volatility as markets look for cues for a lasting ceasefire between the US and Iran.
In a post on Truth Social on Sunday, US president Donald Trump revealed a delay to further strikes on Iranian territory, with a potential deal on the table.
“This would include the Immediate, Complete, and Total OPENING OF THE HORMUZ STRAIT, and an end to Iran’s nuclear threat. Based on this request, I have agreed, for the future benefit of the WORLD and, likewise, the survival of a successful and prosperous Iran, to cancel the attack, subject to being able to rapidly make a DEAL,” he wrote.
Oil prices fell immediately as the week began, with WTI and Brent crude both down more than 8% on Monday.
Stocks face tough seasonality into US Midterms
US stocks face seasonal friction between now and October, in the run-up to the US Midterm elections, analysis from trading resource Mosaic Asset Company warns.
The S&P 500 finished July down 0.8%, while the tech-heavy Nasdaq Composite Index saw its worst July losses since 2006 at -3.2%.
In the latest edition of its regular newsletter, The Market Mosaic, flagged seasonal changes as a major hurdle for equities beginning this month.
“Based on multiple lookback periods, seasonality becomes a much stronger headwind over the next couple months,” it wrote, with data indicating that it could take until the start of Q4 for the situation to improve.
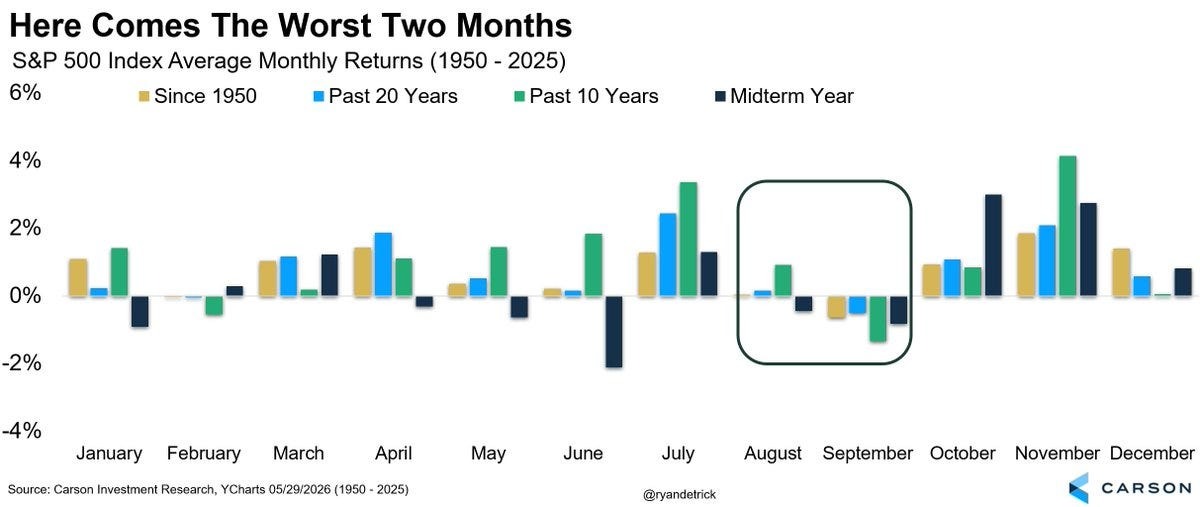
S&P 500 average monthly returns. Source: Mosaic Asset Company
US equities failed to mount a meaningful comeback into the monthly close, even as Asia markets rebounded from a major sell-off centered around semiconductor stocks. Missed earnings and concerns over debt obligations fueled a $620 billion wipeout over just two days. This comes as combined 2026 capex guidance from Alphabet, Microsoft, Amazon, and Meta is now tracking toward $730 billion.
For Bitcoin itself, the picture has a familiar precedent, analyst Benjamin Cowen, founder and CEO of quantitative analysis platform Into the Cryptoverse argued.
“Bitcoin is still generally tracking the average of prior midterm years (only slightly elevated off of that average),” he reported on X while tracking year-to-date return on investment.
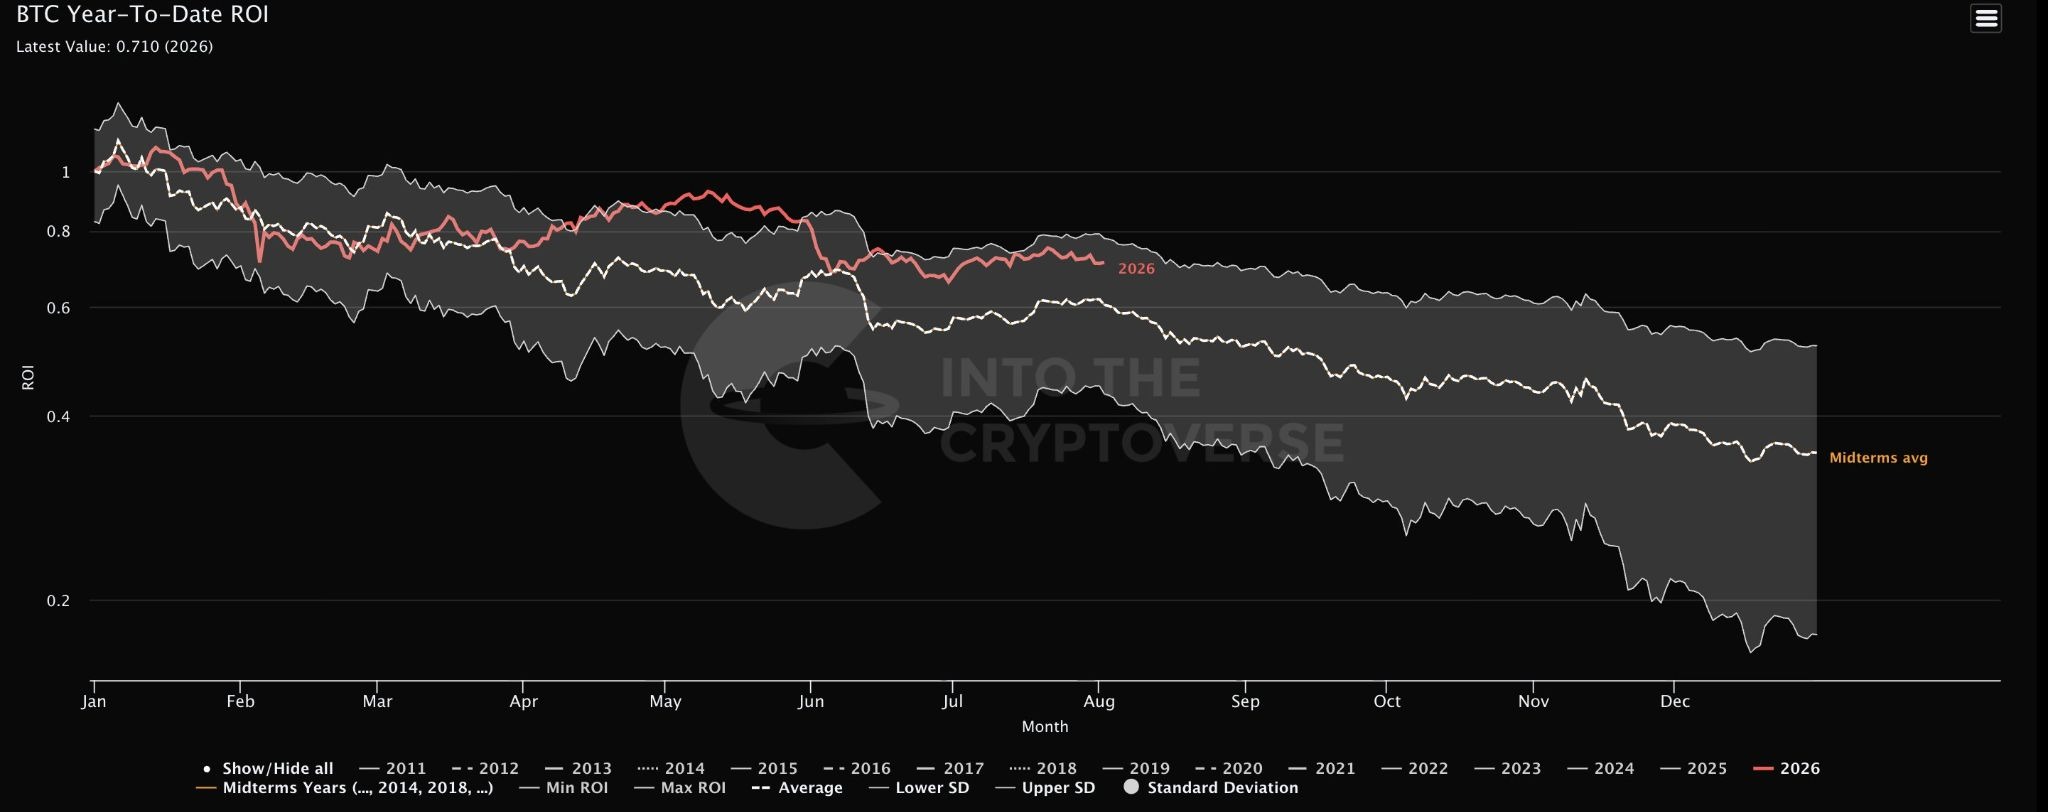
Bitcoin RoI comparison. Source: Benjamin Cowen on X.com
Exchange flows cool after Coldcard shock
Bitcoin investors continue to react to the low-entropy bug in Coldcard hardware wallets as funds are being stolen for a fourth consecutive day. The hack, which appeared to be centered on a security vulnerability originating in 2021, had drained BTC worth nearly $90 million as of Sunday.
Alex Thorn, head of firmwide research at crypto and blockchain research platform Galaxy Research, told Coldcard users to move funds “ASAP” and employ high transaction fees to reduce the remaining time spent interacting with Coldcard wallets to a minimum.
Exchange transaction data, however, does not show a mass influx of BTC from users seeking a temporary alternative to hardware wallet storage or converting their funds to ETFs. Data from CryptoQuant shows net inflows of 34,932 BTC on Friday and 8,768 BTC on Sunday. While this constitutes a significant inflow day, it is not out of the ordinary and matches the levels seen throughout the month.
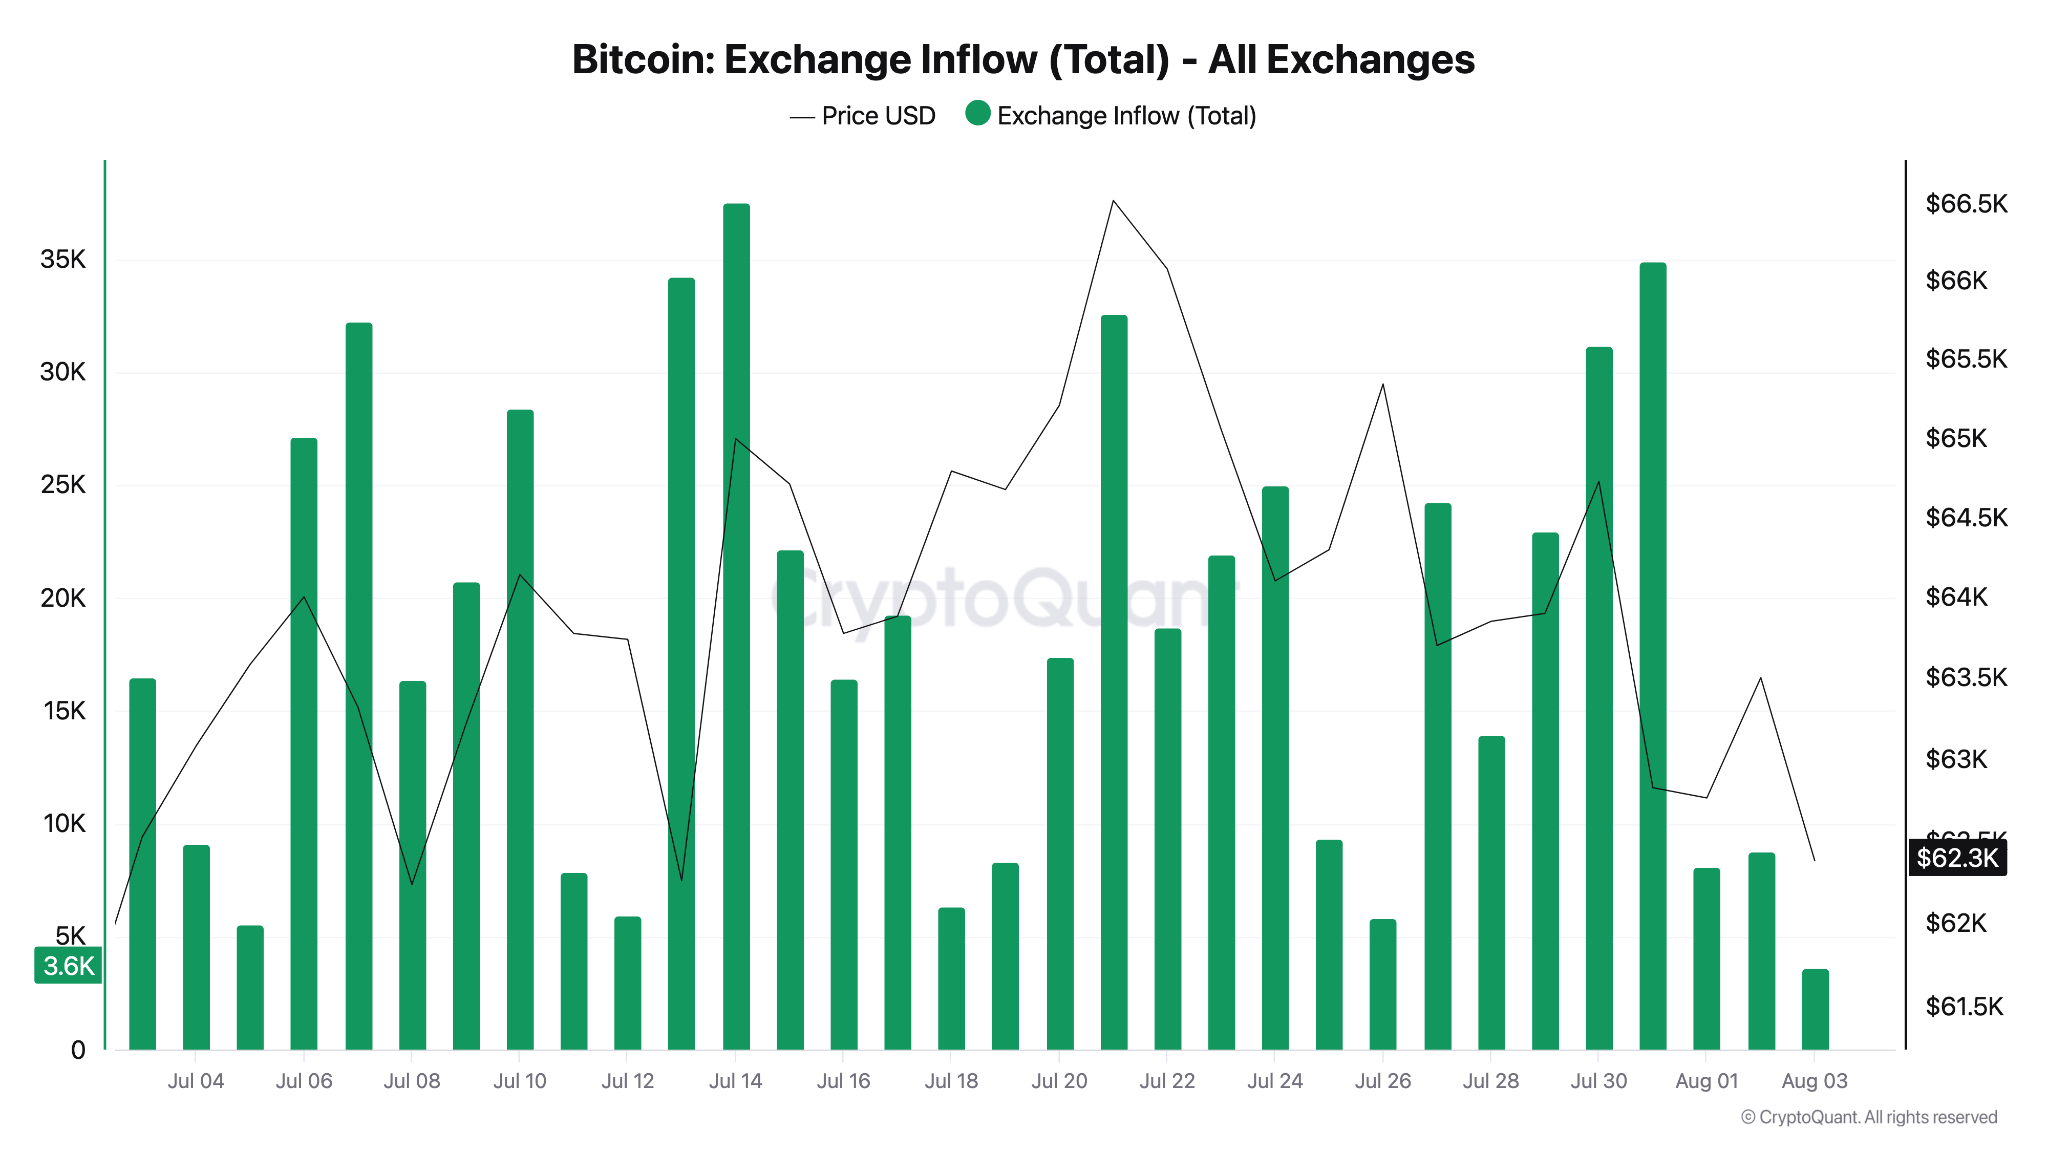
Bitcoin exchange inflows. Source: CryptoQuant
The number of depositing transactions saw a more pronounced reaction, spiking to match some of its highest daily totals since March before dropping significantly over the weekend. Exchanges recorded 31,217 inbound BTC transactions on Friday, while on Sunday, the number fell to 19,537.
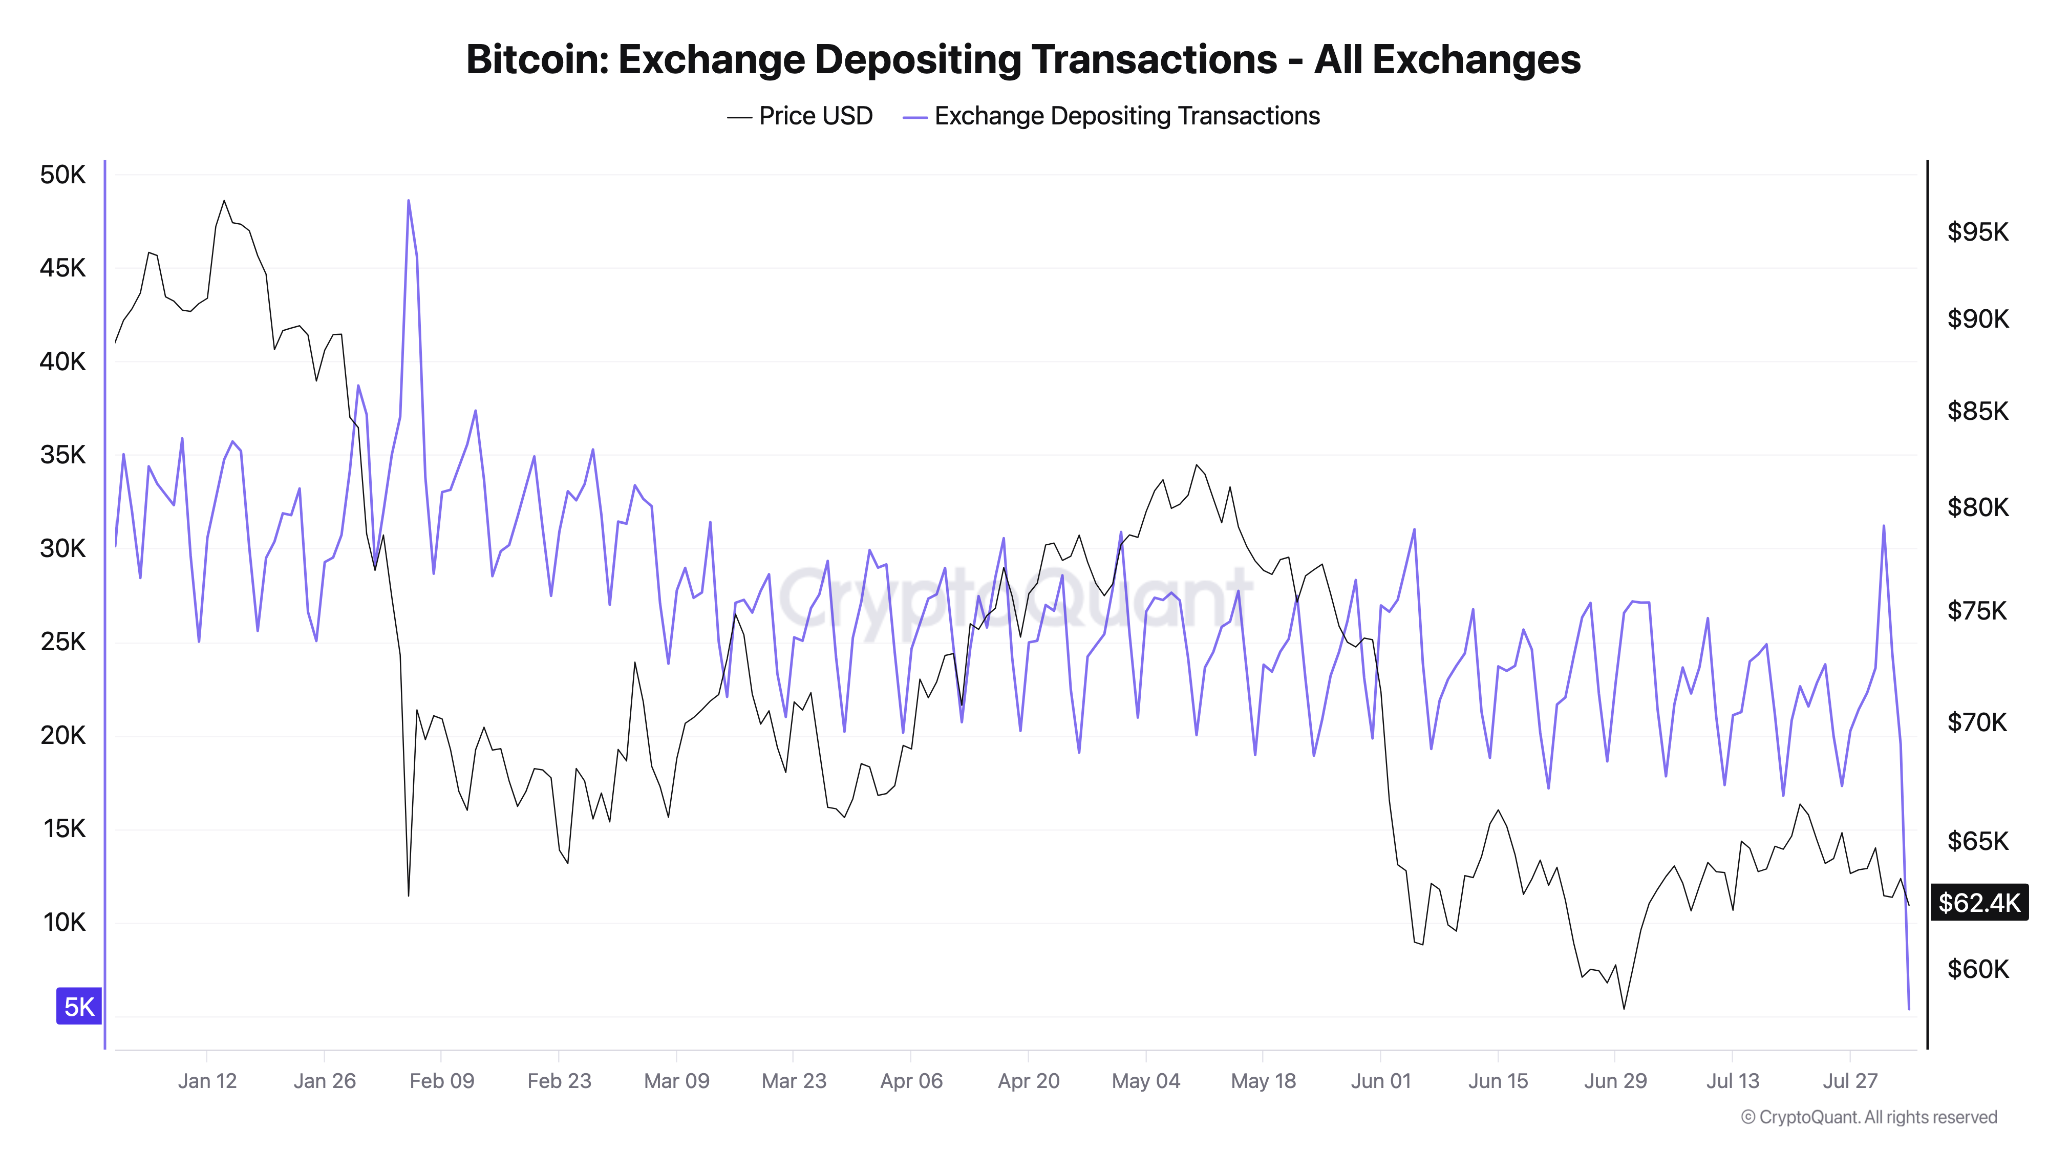
Bitcoin exchange deposit transactions. Source: CryptoQuant
Responding, CryptoQuant head of research, Julio Moreno, revealed that the influx was driven by transactions of between 1 and 10 BTC. At around 7,300, these saw their highest daily total since early February.
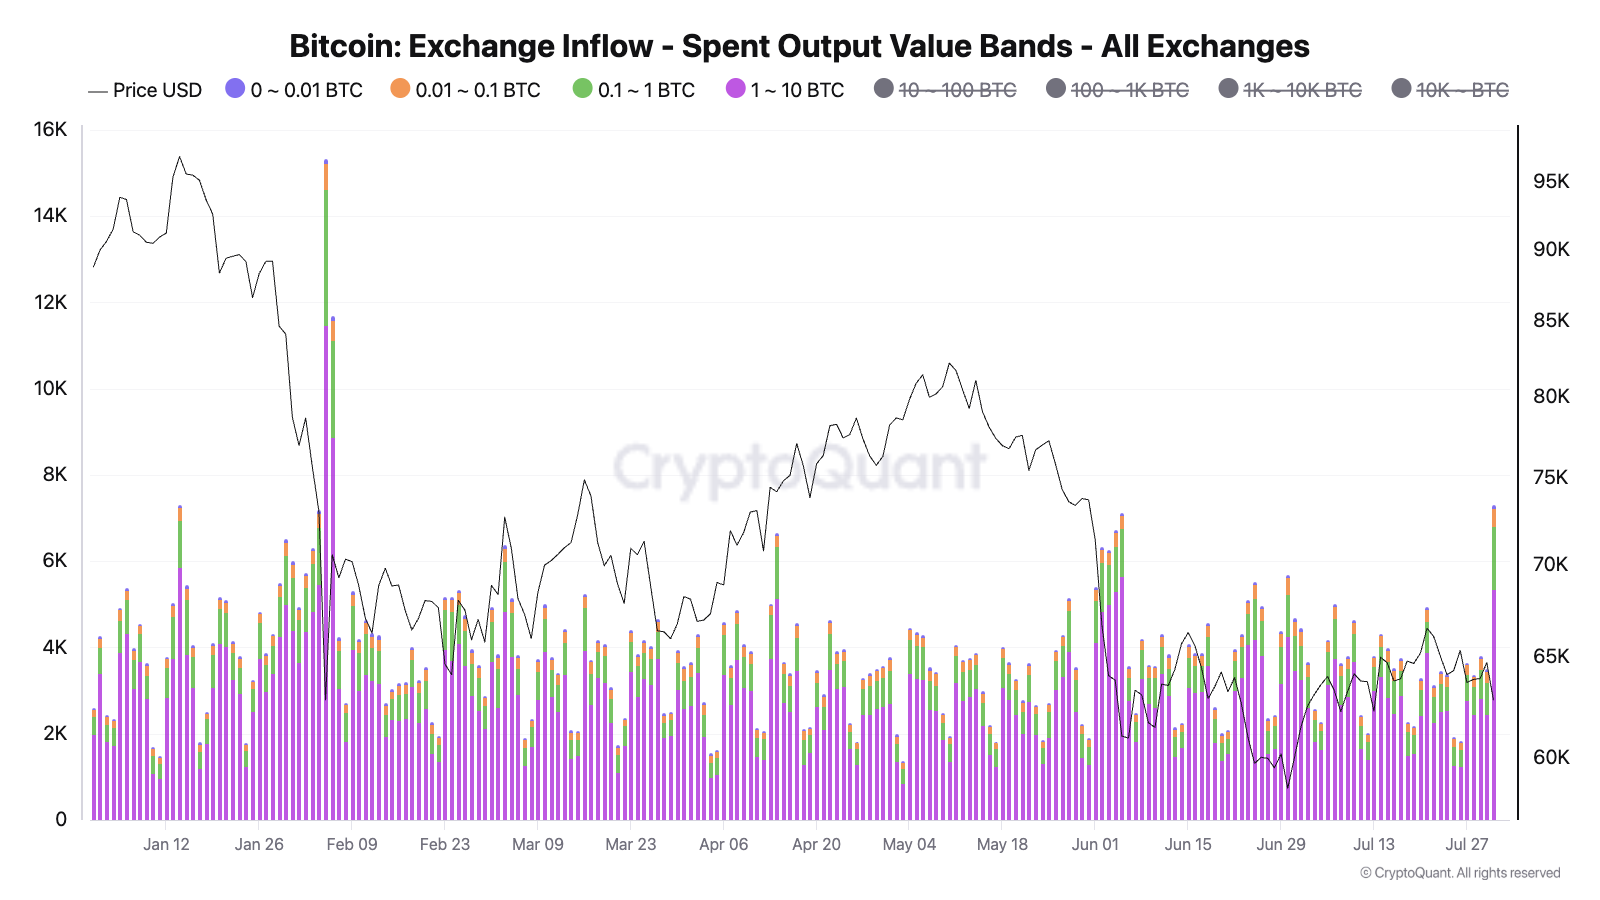
Bitcoin exchange inflows by transaction size. Source: Julio Moreno on X.com
In some of its latest analysis released on Monday, CryptoQuant observed that on a rolling 30-day basis, Bitcoin’s long-term holders (LTHs) remained in a broad accumulation phase.
“Data shows that the BTC LTH Accumulation & Distribution (30D) indicator is currently recording LTH Supply Inflow of around 220.4K BTC. This suggests that the amount of Bitcoin flowing into the Long-Term Holder cohort continues to outweigh the amount being distributed back to the market,” it wrote.
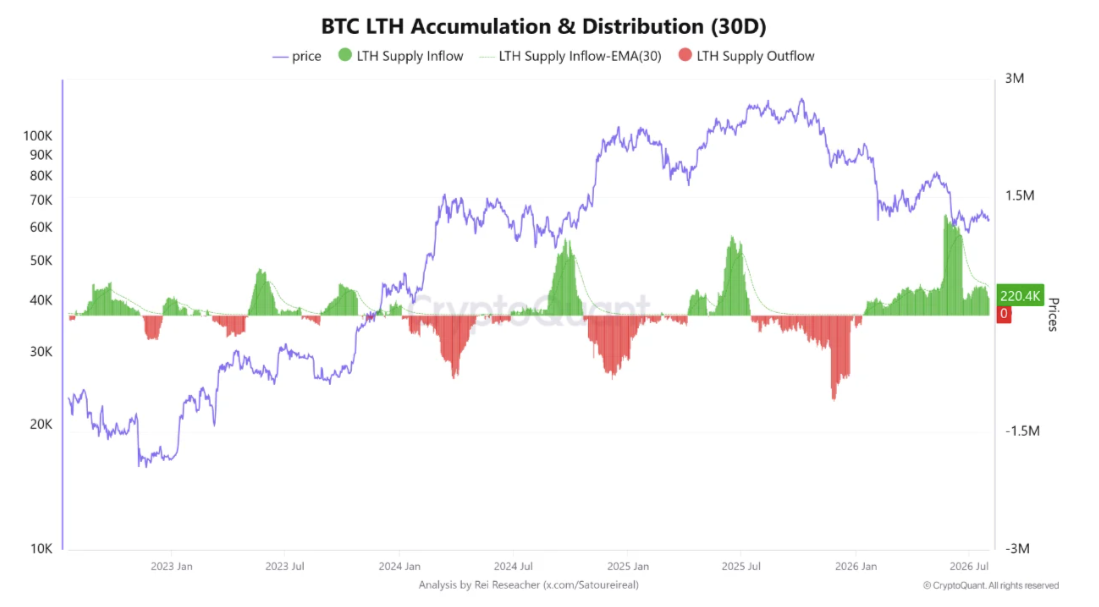
Bitcoin 30-day LTH accumulation and distribution (screenshot). Source: CryptoQuant
Trader consensus sees a “red” August for Bitcoin
Bitcoin continues to see key trend lines act as resistance into August as market participants warn over bear-market history repeating. BTC/USD finished July up 7.4%, slightly below its 2025 performance, per data from CoinGlass.
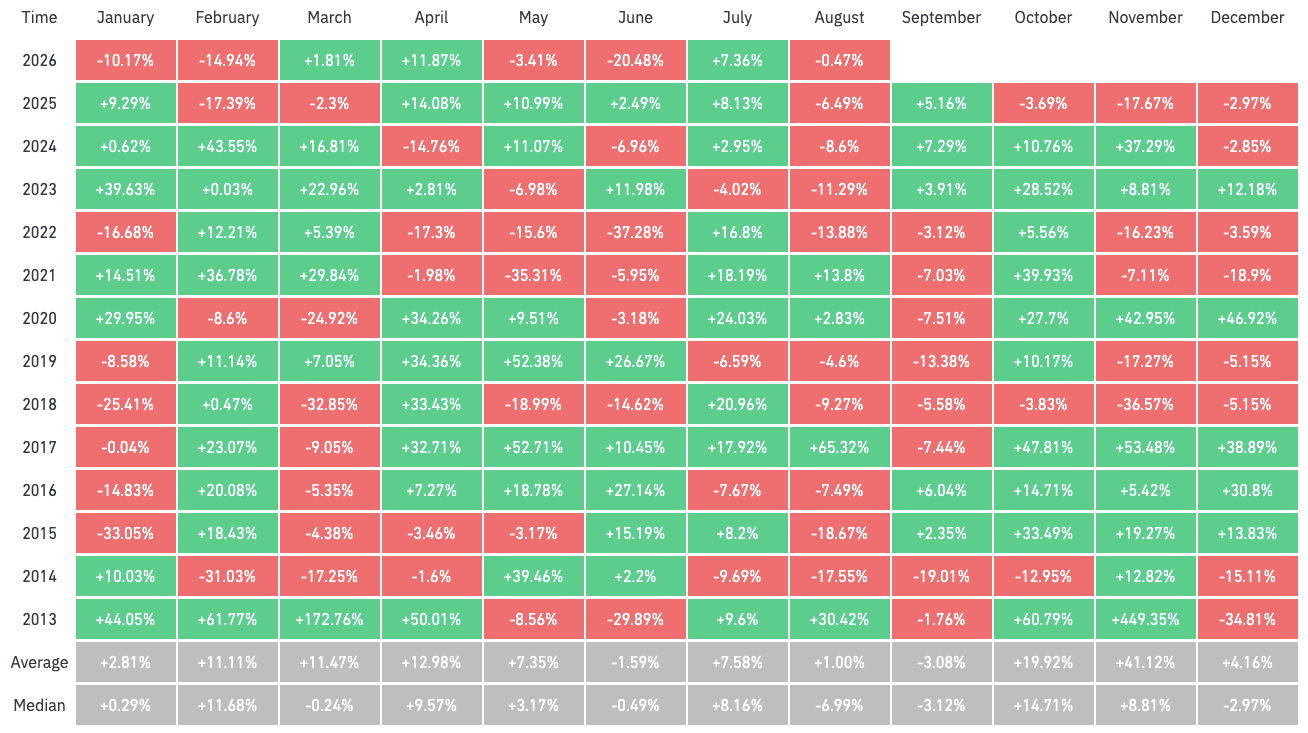
BTC/USD monthly returns (screenshot). Source: CoinGlass
Despite this, expectations remain for downside BTC price pressure to return this month, keeping the 2026 bear market in line with historical patterns. The 50-month exponential moving average (EMA) at $65,827 is an important psychological level for traders.
“It has been confirmed. The 50-Month EMA continues to act as resistance,” trader and analyst Rekt Capital wrote in an X post on Sunday.
“Continued rejection from the 50 EMA would set price up for downside continuation over time.”
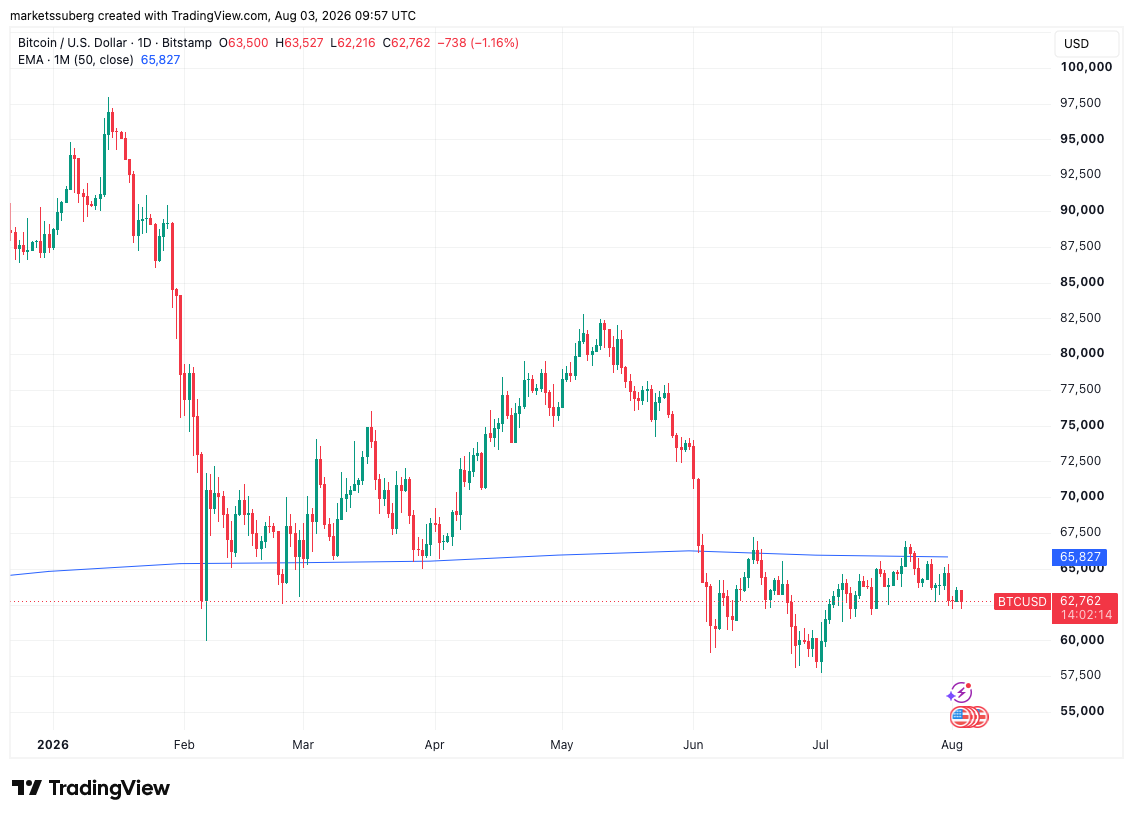
BTC/USD one-day chart with 50-month EMA. Source: Cointelegraph/TradingView
On shorter time frames, CoinGlass data that tracks clusters of high-leverage BTC bets in the derivatives market showed $64,200 as a potential area of forced liquidations should price reverse higher.
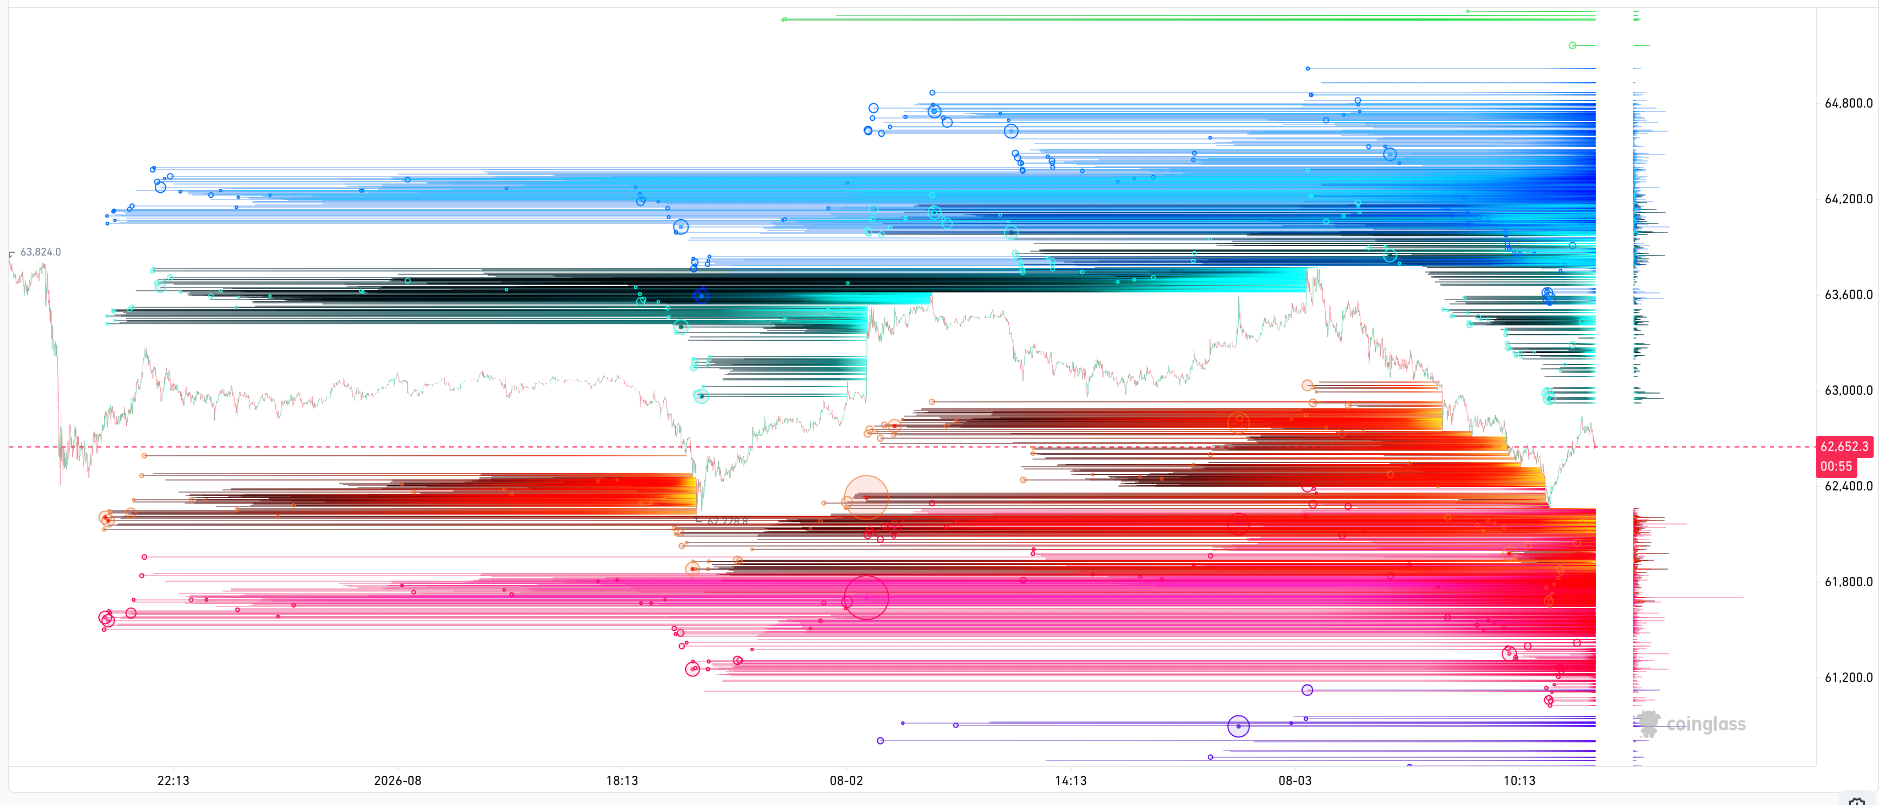
BTC liquidation heatmap. Source: CoinGlass
Quant analyst David Eng described the price as “sitting on its long-term statistical floor” near $63,000. Eng uploaded data from the power law model, which sees price growing as a power of time.
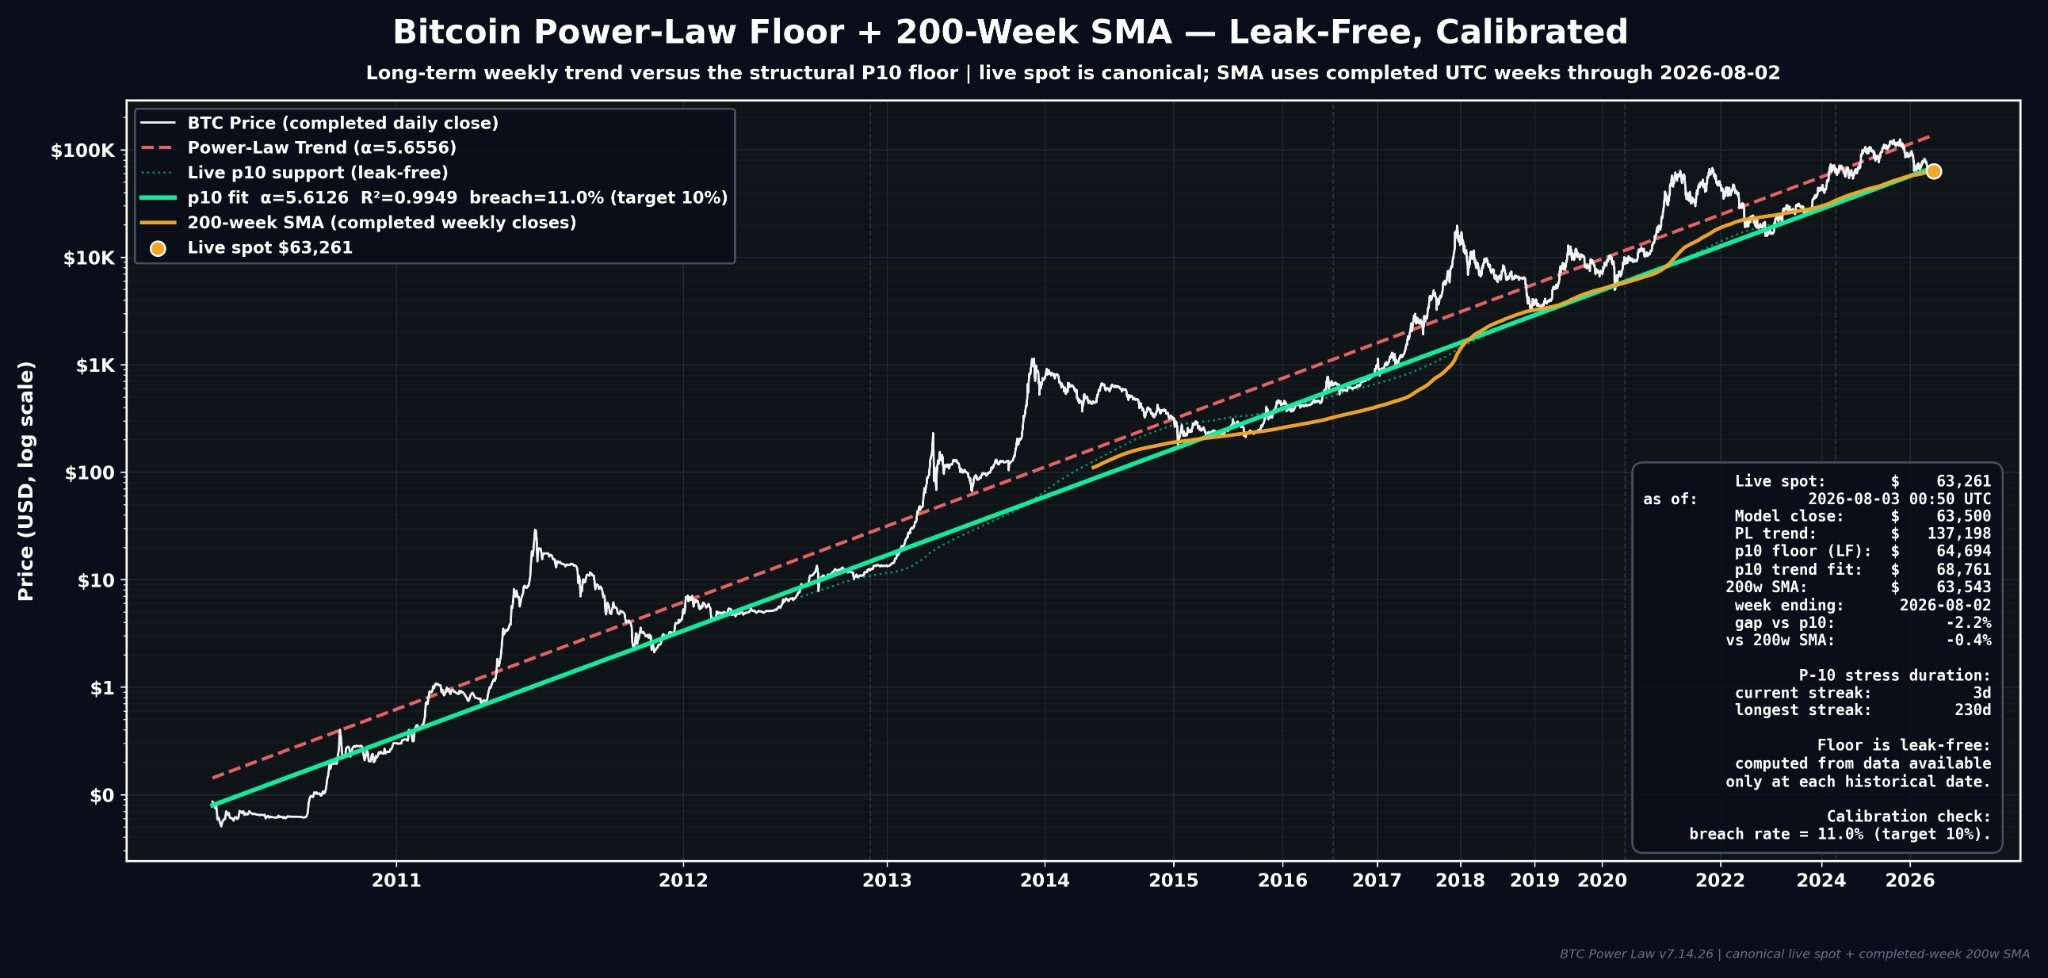
Bitcoin Power Law data. Source: David Eng on X.com
Bitcoin heads into August with long-term holders quietly accumulating even as short-term charts flash caution. Whether the month breaks its historical pattern of weakness will likely come down to how the next few macro data points land.